Stacked Area Chart
Previous
Regression Curve Chart
Next
Stacked Bar Chart
Loading...

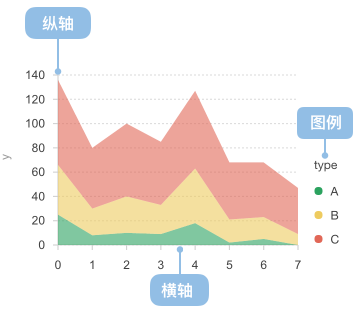
Stacked area charts are similar to basic area charts, with the key difference that each series starts from the cumulative total of the previous series. They display how each part contributes to the whole over time or across categories, emphasizing the part-to-whole relationship.
The overall area (top boundary) represents the total amount of all data. The stacked layers represent the magnitude of each series. Stacked area charts are particularly useful for showing how composition changes within a total. They are generally not suitable for datasets containing negative values. They are ideal for comparing multiple series over time.
Based on stacked area charts, if you normalize the total at each position to 100%, you get a percentage stacked area chart. While it does not reflect changes in the absolute total, it clearly shows how each category’s share changes over time or across ordered dimensions—very useful when analyzing large, time-varying, or ordered datasets.
| Chart Type | Stacked Area Chart |
|---|---|
| Suitable Data | One categorical field, two continuous fields |
| Function | Compare the change/trend of each grouped series |
| Data-to-Visual Mapping | Two continuous fields mapped to the horizontal and vertical axes Category mapped to color |
| Suitable Data Volume | No more than 12 categories mapped to color; at least two data points per category |
import { Chart } from '@antv/g2';const chart = new Chart({ container: 'container', theme: 'classic' });chart.options({type: 'area',autoFit: true,data: [{ country: 'Asia', year: '1750', value: 502 },{ country: 'Asia', year: '1800', value: 635 },{ country: 'Asia', year: '1850', value: 809 },{ country: 'Asia', year: '1900', value: 5268 },{ country: 'Asia', year: '1950', value: 4400 },{ country: 'Asia', year: '1999', value: 3634 },{ country: 'Asia', year: '2050', value: 947 },{ country: 'Africa', year: '1750', value: 106 },{ country: 'Africa', year: '1800', value: 107 },{ country: 'Africa', year: '1850', value: 111 },{ country: 'Africa', year: '1900', value: 1766 },{ country: 'Africa', year: '1950', value: 221 },{ country: 'Africa', year: '1999', value: 767 },{ country: 'Africa', year: '2050', value: 133 },{ country: 'Europe', year: '1750', value: 163 },{ country: 'Europe', year: '1800', value: 203 },{ country: 'Europe', year: '1850', value: 276 },{ country: 'Europe', year: '1900', value: 628 },{ country: 'Europe', year: '1950', value: 547 },{ country: 'Europe', year: '1999', value: 729 },{ country: 'Europe', year: '2050', value: 408 },{ country: 'Oceania', year: '1750', value: 200 },{ country: 'Oceania', year: '1800', value: 200 },{ country: 'Oceania', year: '1850', value: 200 },{ country: 'Oceania', year: '1900', value: 460 },{ country: 'Oceania', year: '1950', value: 230 },{ country: 'Oceania', year: '1999', value: 300 },{ country: 'Oceania', year: '2050', value: 300 },],encode: { x: 'year', y: 'value', color: 'country' },axis: { x: { title: false }, y: { title: false } },transform: [{type: 'stackY',},],});chart.render();
1. Avoid using stacked area charts for category comparisons
Stacked Area Chart (Not Recommended)
import { Chart } from '@antv/g2';const chart = new Chart({ container: 'container', theme: 'classic' });chart.options({type: 'area',autoFit: true,data: [{ year: '2001', genre: 'Strategy', sold: 11500 },{ year: '2001', genre: 'Sports', sold: 27500 },{ year: '2001', genre: 'Action', sold: 6000 },{ year: '2001', genre: 'Shooter', sold: 3500 },{ year: '2001', genre: 'Other', sold: 1500 },{ year: '2002', genre: 'Strategy', sold: 10500 },{ year: '2002', genre: 'Sports', sold: 29500 },{ year: '2002', genre: 'Action', sold: 8000 },{ year: '2002', genre: 'Shooter', sold: 4500 },{ year: '2002', genre: 'Other', sold: 1800 },{ year: '2003', genre: 'Strategy', sold: 12500 },{ year: '2003', genre: 'Sports', sold: 30500 },{ year: '2003', genre: 'Action', sold: 4000 },{ year: '2003', genre: 'Shooter', sold: 6500 },{ year: '2003', genre: 'Other', sold: 2000 },{ year: '2004', genre: 'Strategy', sold: 14500 },{ year: '2004', genre: 'Sports', sold: 31500 },{ year: '2004', genre: 'Action', sold: 5000 },{ year: '2004', genre: 'Shooter', sold: 6800 },{ year: '2004', genre: 'Other', sold: 1800 },],encode: { x: 'year', y: 'sold', color: 'genre' },axis: { x: { title: false }, y: { title: false } },transform: [{type: 'stackY',},],});chart.render();
Stacked Bar Chart (Recommended)
import { Chart } from '@antv/g2';const chart = new Chart({ container: 'container', theme: 'classic' });chart.options({type: 'interval',autoFit: true,data: [{ year: '2001', genre: 'Strategy', sold: 11500 },{ year: '2001', genre: 'Sports', sold: 27500 },{ year: '2001', genre: 'Action', sold: 6000 },{ year: '2001', genre: 'Shooter', sold: 3500 },{ year: '2001', genre: 'Other', sold: 1500 },{ year: '2002', genre: 'Strategy', sold: 10500 },{ year: '2002', genre: 'Sports', sold: 29500 },{ year: '2002', genre: 'Action', sold: 8000 },{ year: '2002', genre: 'Shooter', sold: 4500 },{ year: '2002', genre: 'Other', sold: 1800 },{ year: '2003', genre: 'Strategy', sold: 12500 },{ year: '2003', genre: 'Sports', sold: 30500 },{ year: '2003', genre: 'Action', sold: 4000 },{ year: '2003', genre: 'Shooter', sold: 6500 },{ year: '2003', genre: 'Other', sold: 2000 },{ year: '2004', genre: 'Strategy', sold: 14500 },{ year: '2004', genre: 'Sports', sold: 31500 },{ year: '2004', genre: 'Action', sold: 5000 },{ year: '2004', genre: 'Shooter', sold: 6800 },{ year: '2004', genre: 'Other', sold: 1800 },],encode: { x: 'year', y: 'sold', color: 'genre' },axis: { x: { title: false }, y: { title: false } },transform: [{type: 'stackY',},],});chart.render();
Normalize the total at each position to 100% to highlight proportion changes.
import { Chart } from '@antv/g2';const chart = new Chart({ container: 'container' });chart.options({type: 'view',autoFit: true,data: [{ country: 'Asia', year: '1750', value: 502 },{ country: 'Asia', year: '1800', value: 635 },{ country: 'Asia', year: '1850', value: 809 },{ country: 'Asia', year: '1900', value: 947 },{ country: 'Asia', year: '1950', value: 1402 },{ country: 'Asia', year: '1999', value: 3634 },{ country: 'Asia', year: '2050', value: 5268 },{ country: 'Africa', year: '1750', value: 106 },{ country: 'Africa', year: '1800', value: 107 },{ country: 'Africa', year: '1850', value: 111 },{ country: 'Africa', year: '1900', value: 133 },{ country: 'Africa', year: '1950', value: 221 },{ country: 'Africa', year: '1999', value: 767 },{ country: 'Africa', year: '2050', value: 1766 },{ country: 'Europe', year: '1750', value: 163 },{ country: 'Europe', year: '1800', value: 203 },{ country: 'Europe', year: '1850', value: 276 },{ country: 'Europe', year: '1900', value: 408 },{ country: 'Europe', year: '1950', value: 547 },{ country: 'Europe', year: '1999', value: 729 },{ country: 'Europe', year: '2050', value: 628 },],encode: { x: 'year', y: 'value', color: 'country' },transform: [{ type: 'stackY' }, { type: 'normalizeY' }],axis: { x: { title: false }, y: { title: false, labelFormatter: '.0%' } },children: [{type: 'area',tooltip: { items: [{ channel: 'y0', valueFormatter: '.0%' }] },},{ type: 'line', tooltip: false },],});chart.render();
Use gradient fill to enhance visual appeal and highlight layering.
import { Chart } from '@antv/g2';const chart = new Chart({container: 'container',theme: 'classic',autoFit: true,});chart.options({type: 'area',data: {type: 'fetch',value: 'https://assets.antv.antgroup.com/g2/stocks.json',transform: [{type: 'filter',callback: (d) => d.symbol === 'GOOG',},],},encode: {x: (d) => new Date(d.date),y: 'price',},style: {fill: 'linear-gradient(-90deg, white 0%, darkgreen 100%)',},axis: { x: { title: false }, y: { title: false } },});chart.render();
A specific form of stacked area chart that symmetrically distributes layers around a central axis to present the flowing changes in data—especially suitable for showing how multiple categories change over time.
import { Chart } from '@antv/g2';const chart = new Chart({container: 'container',theme: 'classic',autoFit: true,});chart.options({type: 'area',data: {type: 'fetch',value: 'https://assets.antv.antgroup.com/g2/unemployment-by-industry.json',},encode: {x: (d) => new Date(d.date),y: 'unemployed',color: 'industry',},transform: [{ type: 'stackY' },{ type: 'symmetryY' }, // symmetric distribution],axis: { x: { title: false }, y: { title: false } },});chart.render();
Show layered effects across categories using special ordering and smooth curves to create a flowing look.
import { Chart } from '@antv/g2';const chart = new Chart({container: 'container',theme: 'classic',autoFit: true,});chart.options({type: 'area',data: {type: 'fetch',value:'https://gw.alipayobjects.com/os/bmw-prod/f38a8ad0-6e1f-4bb3-894c-7db50781fdec.json',},encode: {x: (d) => new Date(d.year),y: 'revenue',series: 'format',color: 'group',shape: 'smooth', // smooth curve},transform: [{type: 'stackY',orderBy: 'maxIndex',reverse: true,},],axis: {x: { title: false },y: { title: false, labelFormatter: '~s' },},tooltip: { channel: 'y', valueFormatter: '.2f' },});chart.render();