Enable JavaScript to run this app.
G2
Chart Gallery
Docs
Examples
Theme
Ecosystem
Products
5.4.8
📈 Chart Gallery
Next
Arc Diagram
Loading...
Chart Gallery
Explore rich data visualization charts and find the chart type that best suits your needs
Search KeyWord...
Filter by Type
All
Comparison
Distribution
Flow
Proportion
Interval
Relation
Trend
Time
Map
Other
43
chart types available
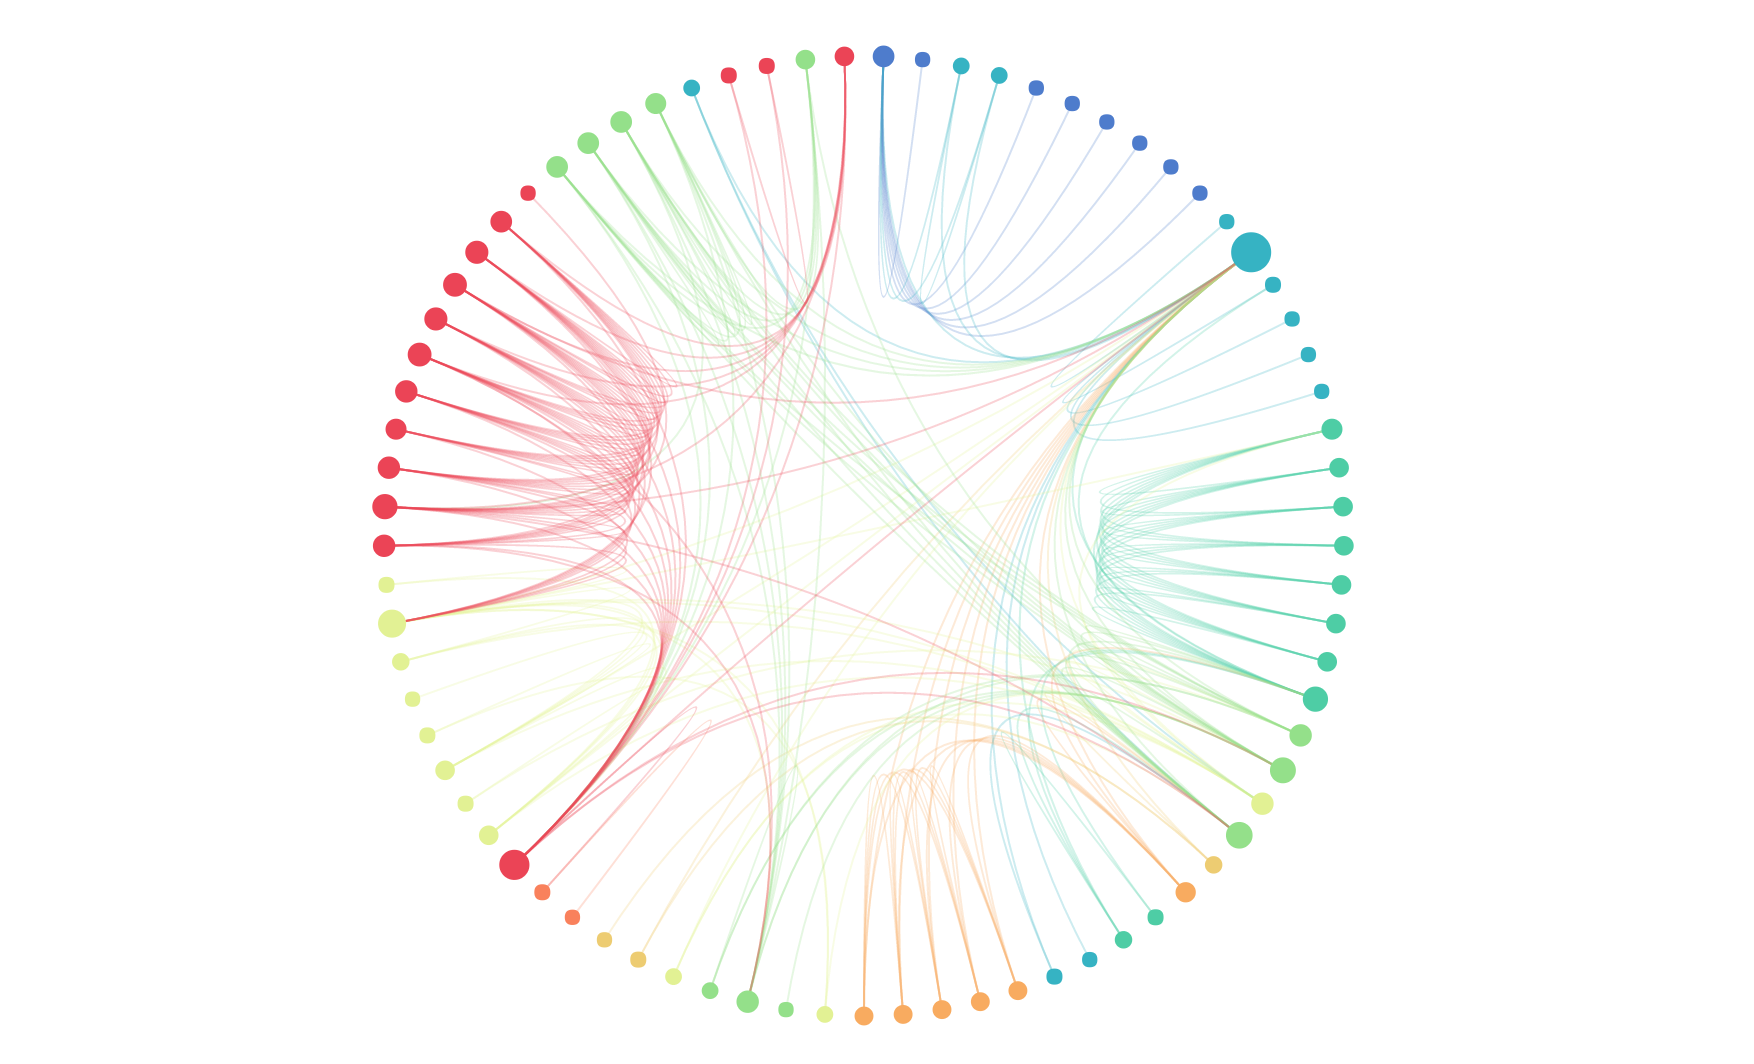
Arc Diagram
Relation
Mosaic Plot
Comparison
Proportion
Bar Chart
Comparison
Bubble Chart
Relation
Distribution
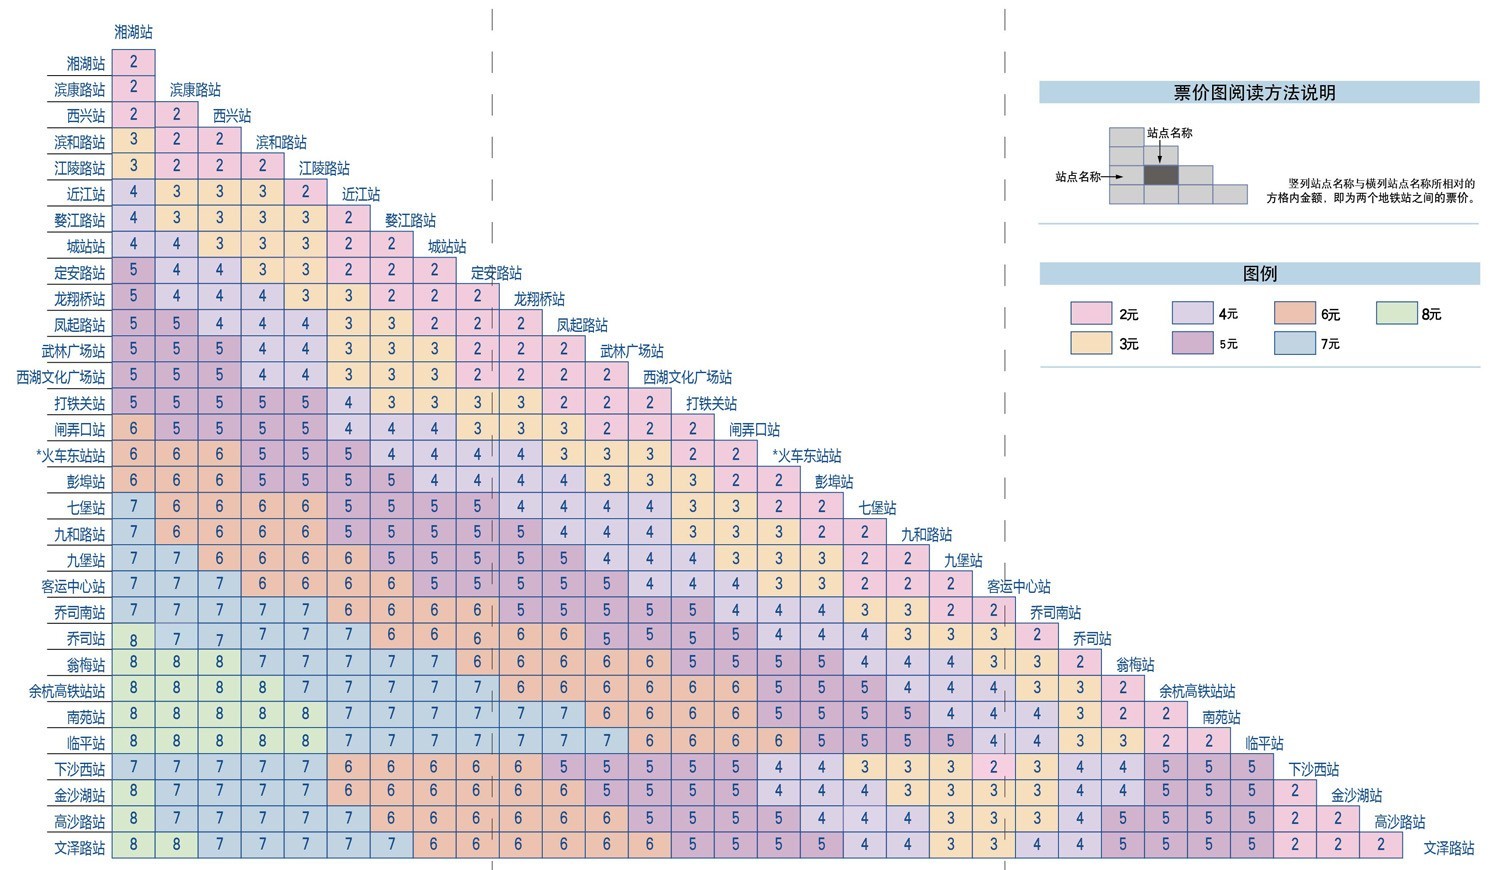
Color Map
Comparison
Distribution
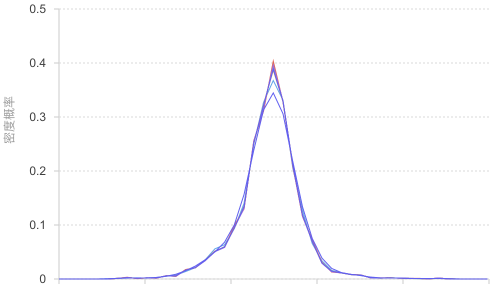
Distribution Curve
Distribution
Dot Map
Distribution
Map
Histogram Chart
Comparison
Distribution
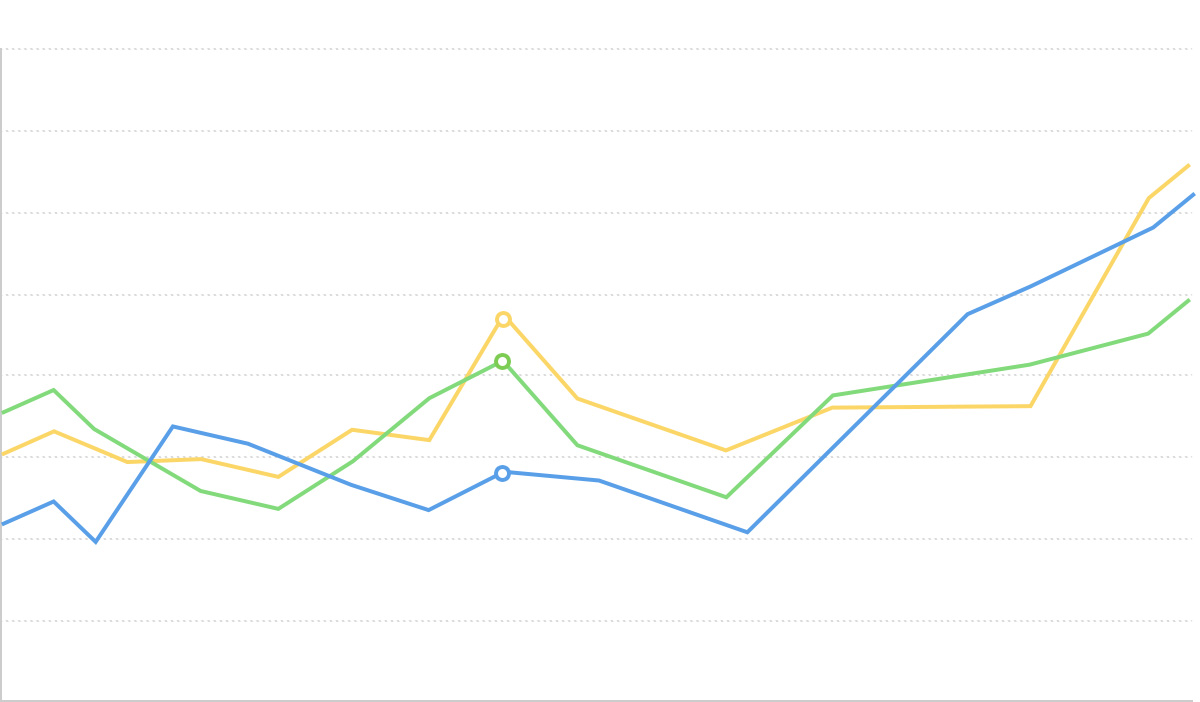
Line Chart
Trend
Time
Pack Chart
Relation
Parallel Coordinates
Relation
Comparison
Radial Bar Chart
Comparison
Regression Curve Chart
Trend
Stacked Area Chart
Comparison
Proportion
Trend
Interval
Time
Stacked Bar Chart
Comparison
Proportion
Stem-and-Leaf Plot
Distribution
Sunburst Chart
Comparison
Proportion
Relation
Treemap
Comparison
Proportion
Relation
Venn Diagram
Relation
Violin Plot
Distribution
Area Chart
Trend
Box Plot
Distribution
Comparison
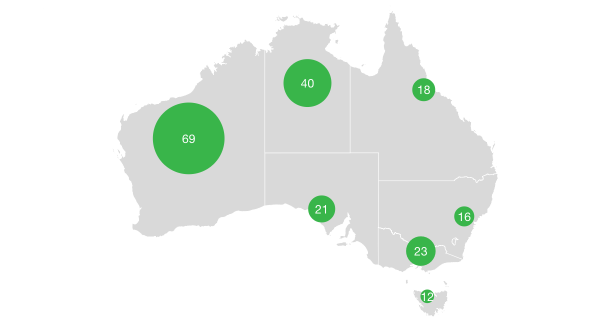
Bubble Map
Map
Comparison
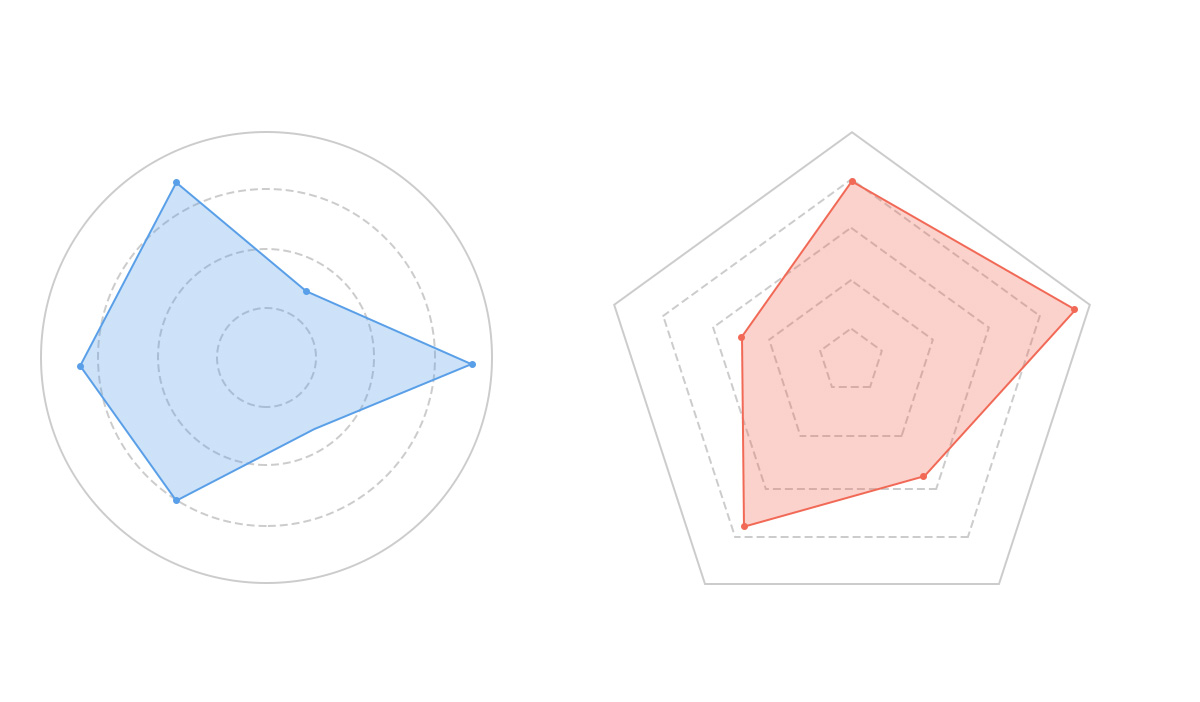
Radar Chart
Comparison
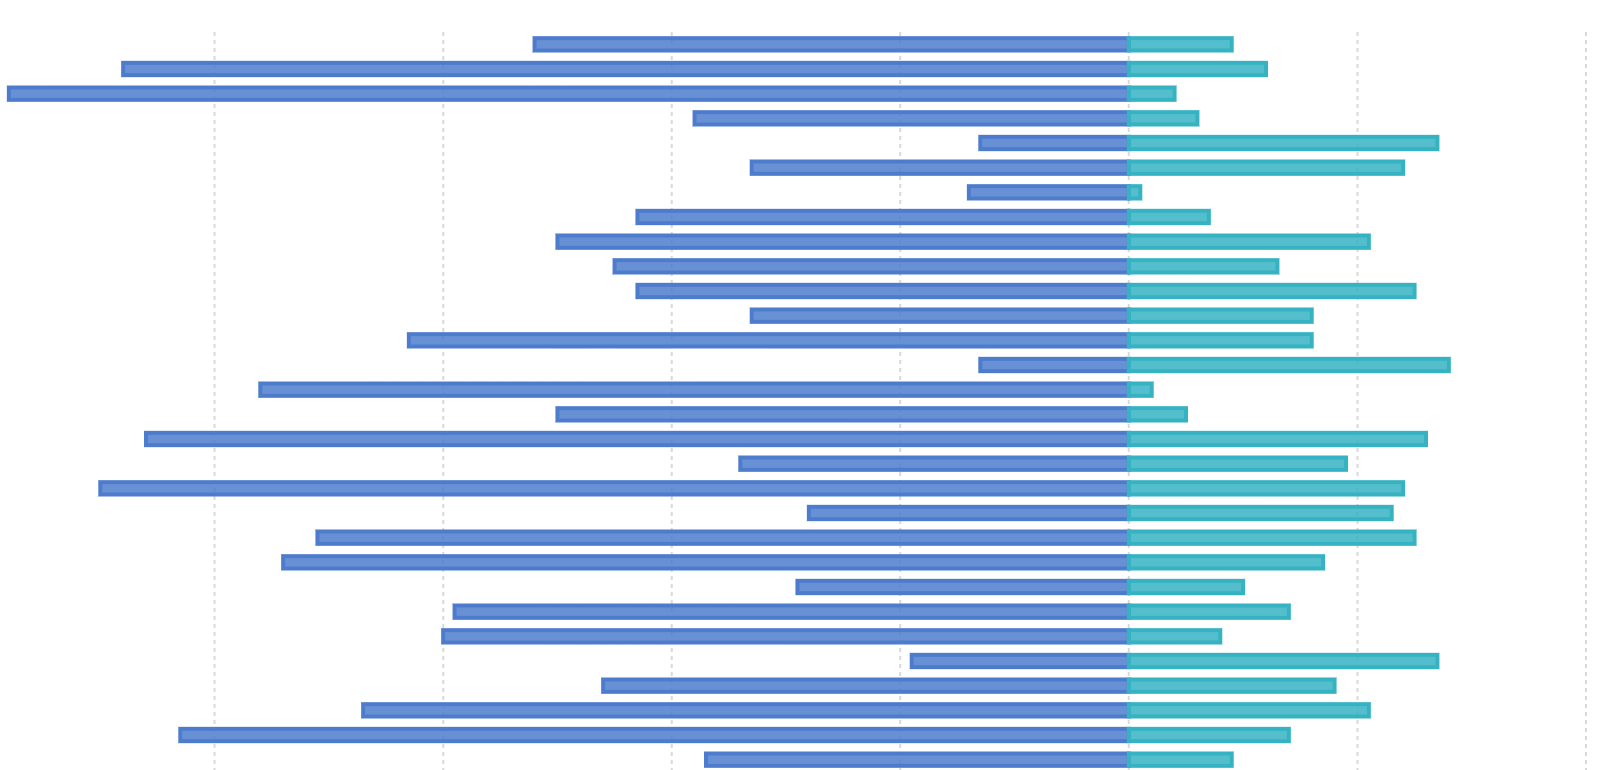
Bi-directional Bar Chart
Comparison
Multi-set Bar Chart
Comparison
Pie Chart
Proportion
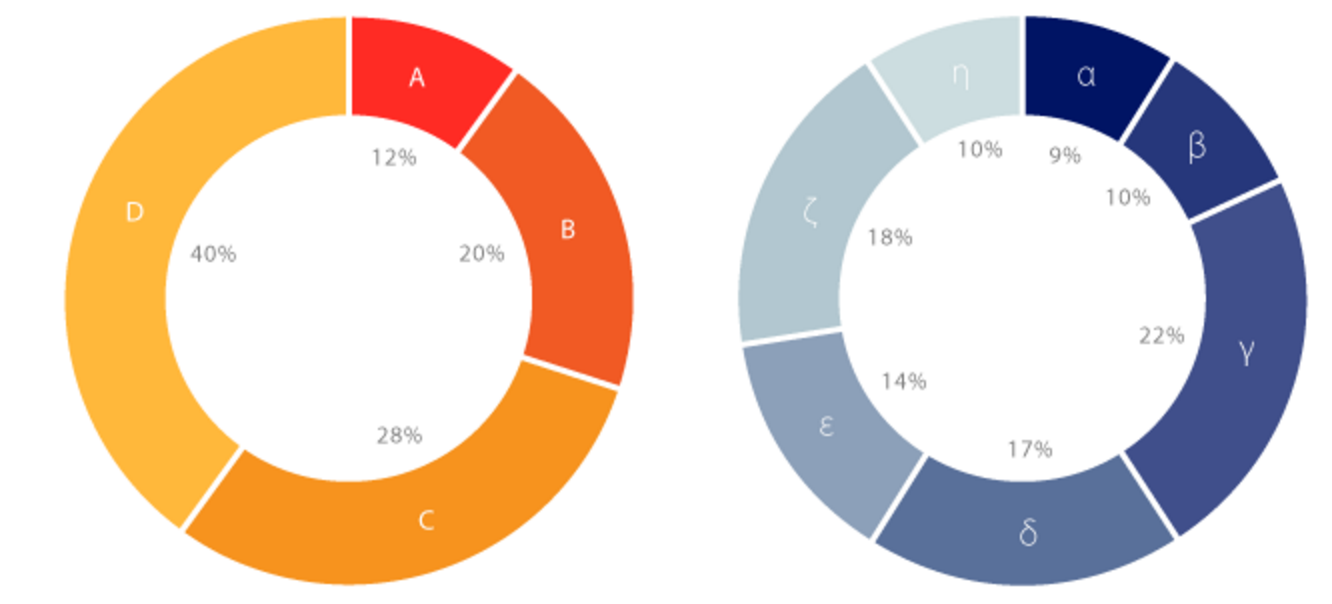
Donut Chart
Proportion
Heatmap
Distribution
Comparison
Choropleth Map
Map
Funnel Chart
Comparison
Flow
K-Chart
Trend
Time
Comparison
Scatter Plot
Distribution
Gauge Chart
Interval
Nightingale Rose Chart
Comparison
Contour Line Chart
Distribution
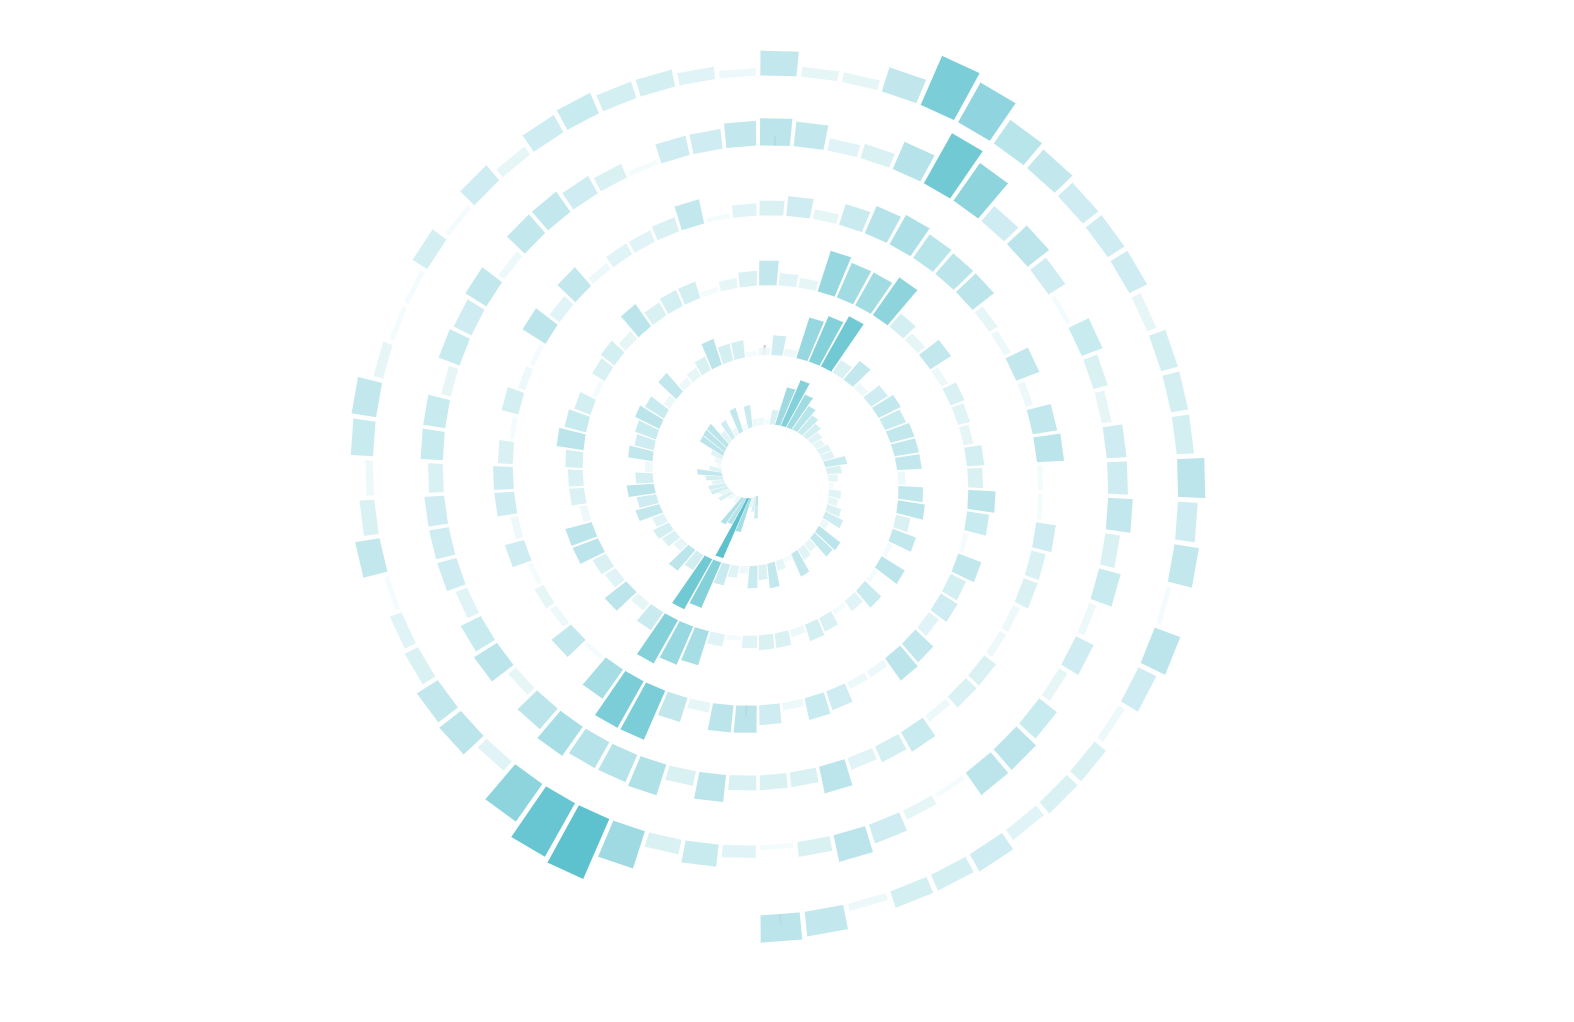
Spiral
Comparison
Time
Word Cloud
Comparison
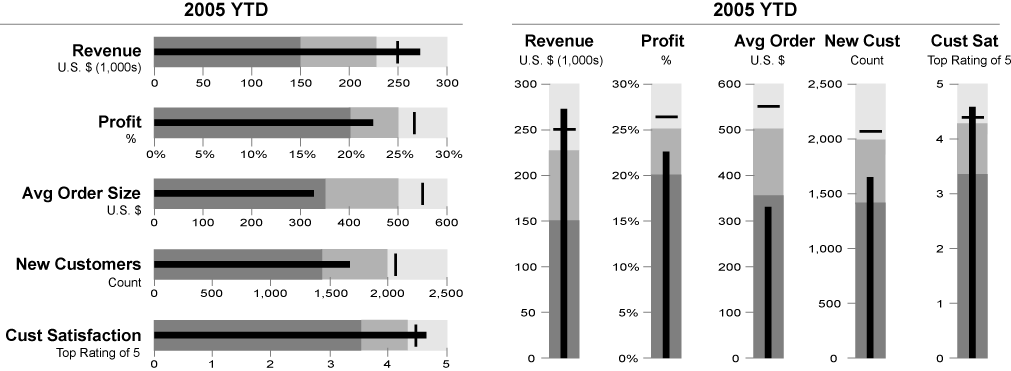
Bullet Chart
Comparison
Distribution
Sankey Diagram
Flow
Relation
Gantt Chart
Time
Comparison
Trend
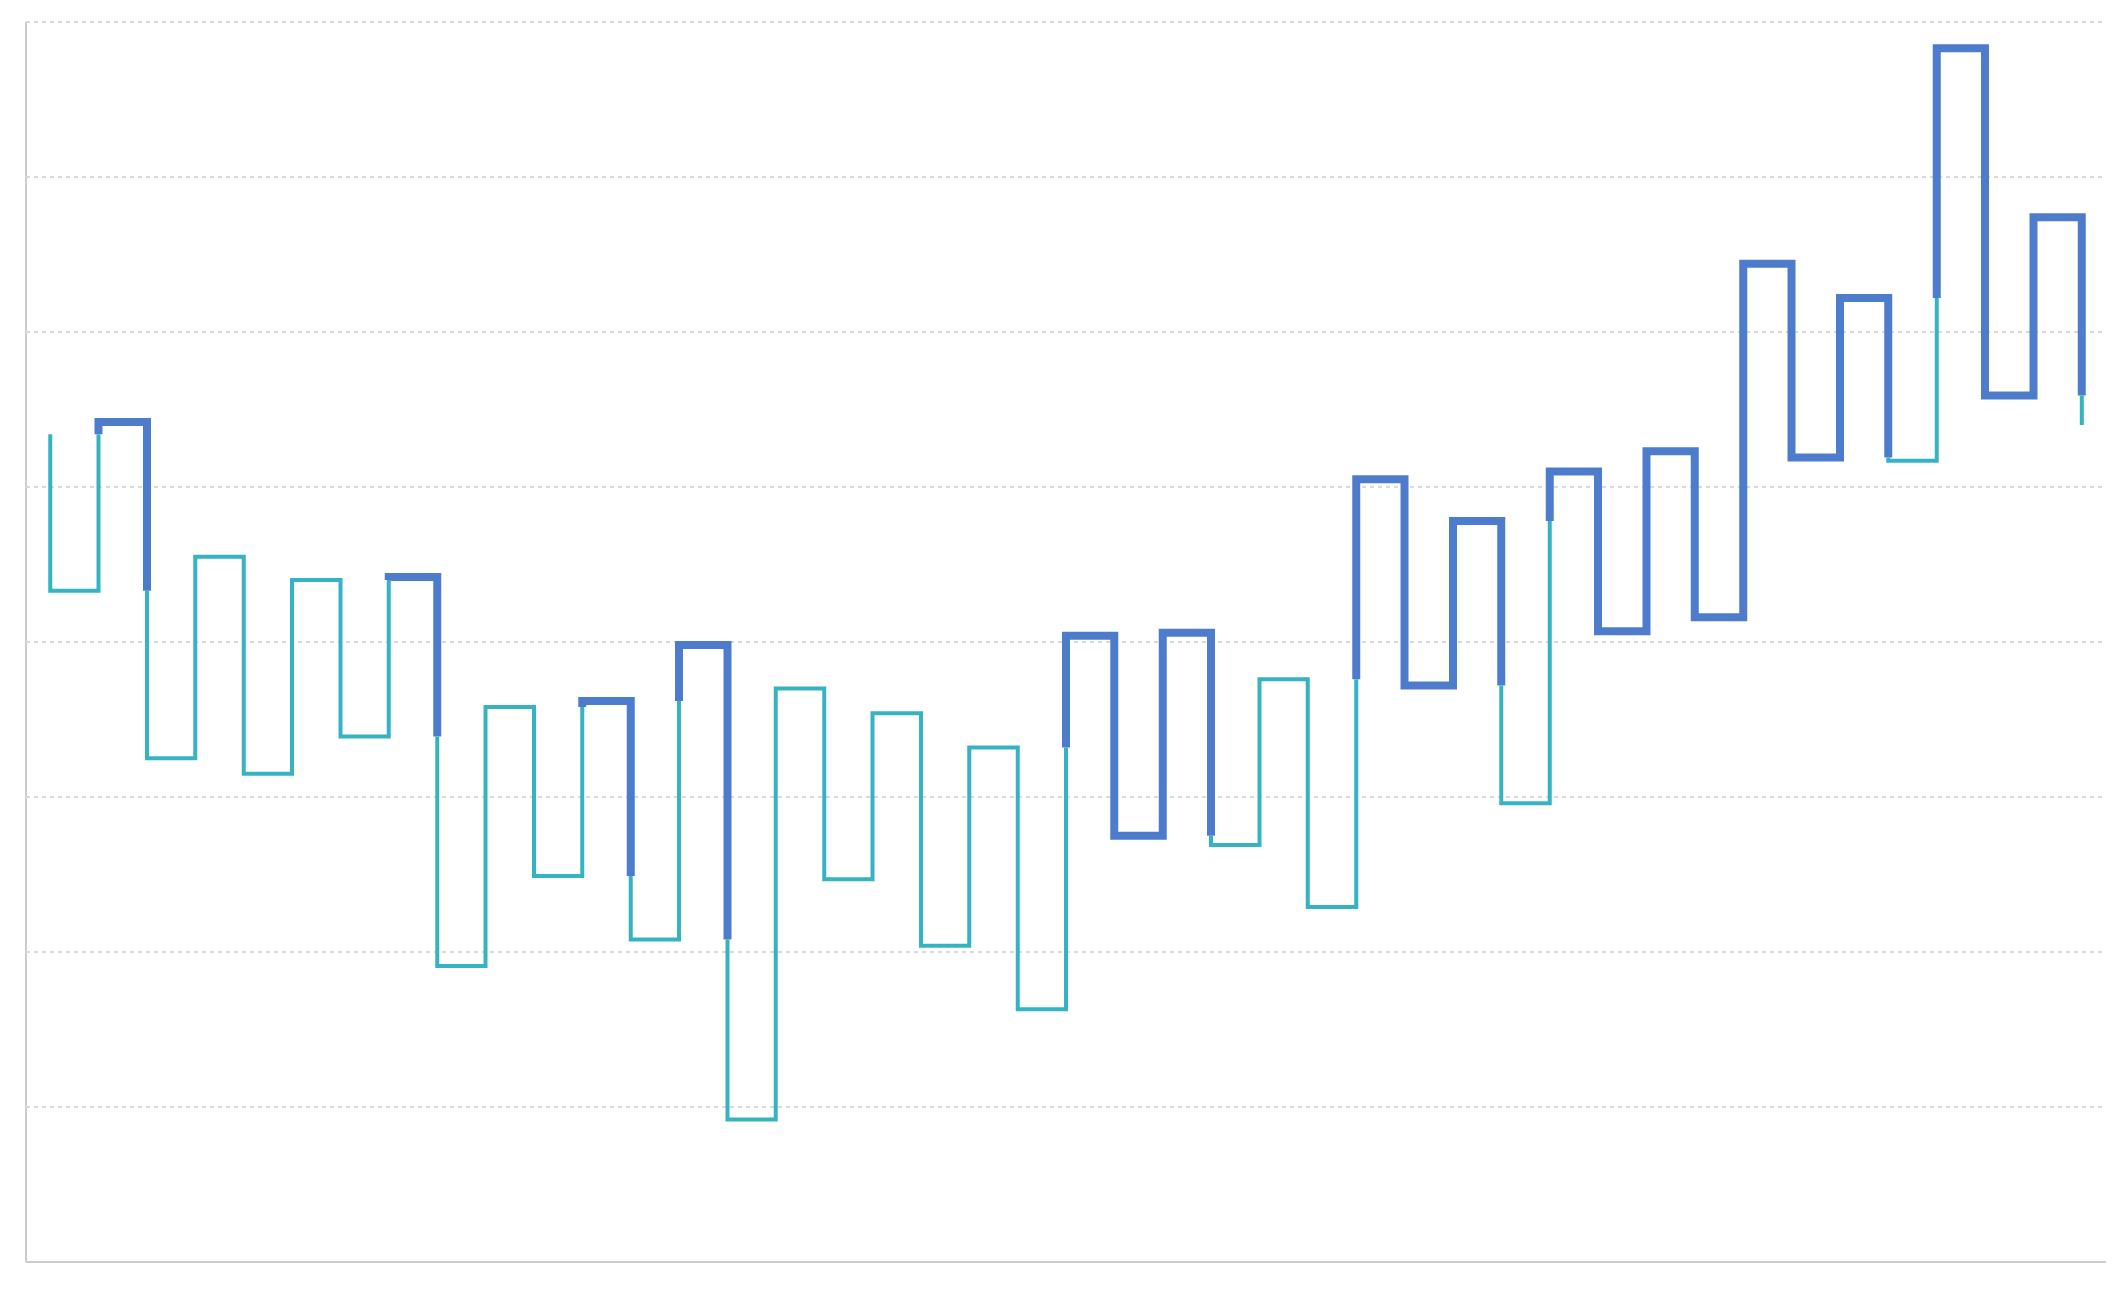
Kagi Chart
Trend
Time
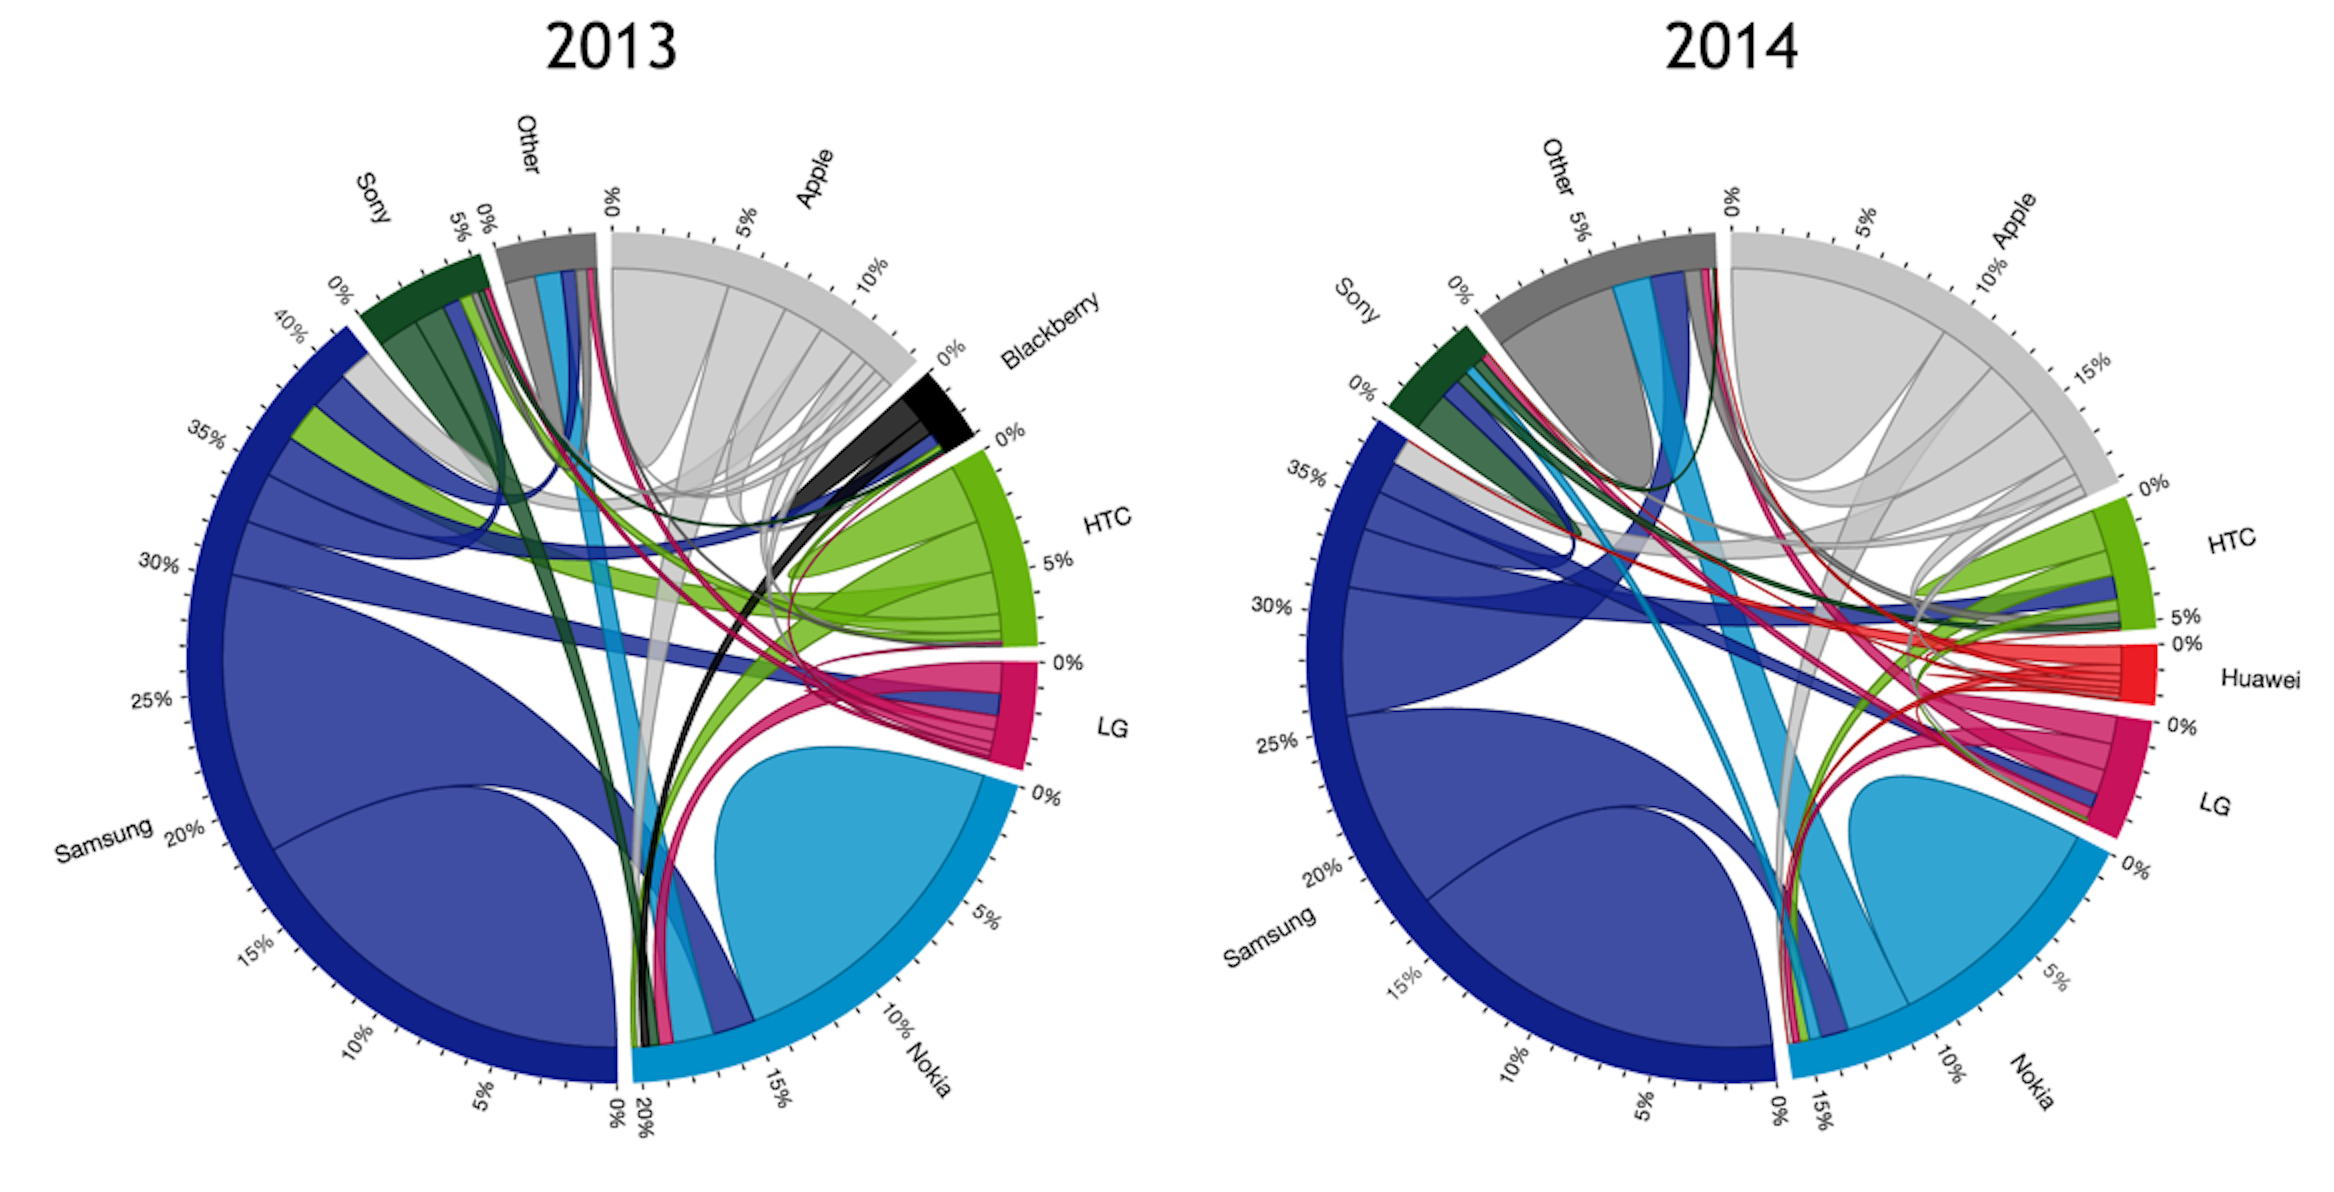
Chord Diagram
Relation