Bubble Map
Previous
Box Plot
Next
Radar Chart
Loading...
Note: G2 5.0 does not directly support complete map background functionality. This page primarily provides concept introduction. For actual applications, additional map components and data need to be imported.
A Bubble Map is a visualization chart that uses bubbles (circles) on a geographic map to represent data size at different geographic locations. The size of the bubble typically represents the magnitude of a value, the position represents geographic coordinates, and colors can be used to distinguish different categories or represent another dimension of values.
Bubble Maps are more suitable for comparing geographically related data than Choropleth Maps. The main disadvantage is that when there are too many large bubbles on the map, they may overlap and affect data display, so this needs to be considered when creating the chart.
Other Names: Bubble Chart Map, Geographic Bubble Chart
| Chart Type | Bubble Map |
|---|---|
| Suitable Data | Data containing geographic coordinates (longitude and latitude) and one or more numeric fields |
| Function | Display geographic distribution and value relationships on a geographic background |
| Data Mapping | Longitude/latitude fields mapped to map position Numeric field mapped to bubble size Category field can be mapped to color Other values can be mapped to color intensity |
| Data Volume | Recommended not to exceed 100 data points to avoid bubble overlap affecting readability |
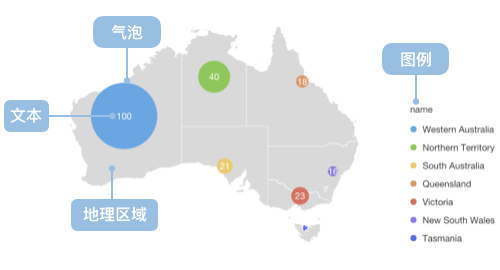
The main components of a Bubble Map include:
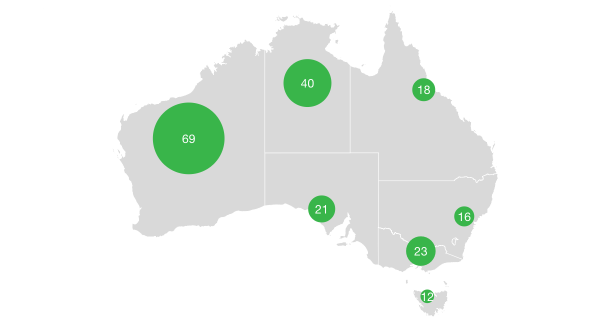
Case 1: Geographic Data Distribution Analysis
Bubble Maps are ideal tools for analyzing data with geographic attributes, clearly showing the distribution pattern of data across geographic space.
Case 2: Regional Comparison Analysis
Through comparison of bubble size and color, different regions' data differences can be effectively compared.
Case 3: Multi-dimensional Geographic Data Display
Bubble Maps can simultaneously display multiple dimensions of information including location, value size, and category.
Case 1: Too Many Data Points Causing Overlap
When there are too many data points on the map, bubbles may overlap and affect clear data display. In such cases, heat maps or dot density maps should be considered.
Case 2: Lack of Geographic Coordinate Information
For data without latitude and longitude information, geocoding conversion is needed first, or other chart types should be considered.
Case 3: Precise Value Display
Bubble Maps focus on showing geographic distribution trends of data and are not suitable for scenarios requiring precise values. Tables or other precise display methods should be used in such cases.
By setting different layers and transparency levels, multiple data series can be displayed on the same map.
Combining geographic boundary data provides richer geographic background information.
Showing changes in bubbles over time through animation.
In G2 5.0, we can implement bubble maps by drawing point on geoView. Here are two practical examples:
Based on London map data, showing the population distribution across different areas:
import { Chart } from '@antv/g2';import { feature } from 'topojson-client';Promise.all([fetch('https://assets.antv.antgroup.com/g2/londonBoroughs.json').then((res) =>res.json(),),fetch('https://assets.antv.antgroup.com/g2/londonCentroids.json').then((res) => res.json(),),]).then((values) => {const [londonBoroughs, londonCentroids] = values;const london = feature(londonBoroughs,londonBoroughs.objects.boroughs,).features;// Add simulated population and GDP data to centroid dataconst bubbleData = londonCentroids.map((d, index) => ({...d,name: d.name || `Area ${index + 1}`, // Ensure each data point has a namepopulation: Math.floor(Math.random() * 500000) + 100000, // 100K-600K populationgdp: Math.floor(Math.random() * 50000) + 20000, // 20K-70K GDPcategory: ['Business', 'Residential', 'Industrial', 'Mixed'][Math.floor(Math.random() * 4)],}));const chart = new Chart({container: 'container',autoFit: true,});chart.options({type: 'geoView',children: [{type: 'geoPath',data: london,style: {fill: 'lightgray',stroke: 'white',lineWidth: 1,},},{type: 'point',data: bubbleData,encode: {x: 'cx',y: 'cy',size: 'population',color: 'category',shape: 'point',},style: {opacity: 0.7,stroke: 'white',lineWidth: 1,},scale: {size: {range: [4, 30],},color: {range: ['#1f77b4', '#ff7f0e', '#2ca02c', '#d62728'],},},tooltip: {title: 'name',items: [{name: 'Population',channel: 'size',valueFormatter: (value) =>`${value ? value.toLocaleString() : 'N/A'} people`,},{name: 'GDP',field: 'gdp',valueFormatter: (value) =>`${value ? value.toLocaleString() : 'N/A'} million`,},{ name: 'Type', field: 'category' },],},},],});chart.render();});
Displaying GDP distribution of major cities worldwide:
import { Chart } from '@antv/g2';// Global major cities data - ensuring data completenessconst worldCities = [{name: 'Beijing',lng: 116.4074,lat: 39.9042,gdp: 4027,population: 2154,region: 'Asia',},{name: 'Shanghai',lng: 121.4737,lat: 31.2304,gdp: 4321,population: 2424,region: 'Asia',},{name: 'New York',lng: -74.0059,lat: 40.7128,gdp: 1700,population: 851,region: 'North America',},{name: 'Los Angeles',lng: -118.2437,lat: 34.0522,gdp: 710,population: 397,region: 'North America',},{name: 'London',lng: -0.1276,lat: 51.5074,gdp: 653,population: 898,region: 'Europe',},{name: 'Tokyo',lng: 139.6917,lat: 35.6895,gdp: 1617,population: 1396,region: 'Asia',},{name: 'Paris',lng: 2.3522,lat: 48.8566,gdp: 709,population: 1068,region: 'Europe',},{name: 'Berlin',lng: 13.405,lat: 52.52,gdp: 147,population: 367,region: 'Europe',},{name: 'Sydney',lng: 151.2093,lat: -33.8688,gdp: 337,population: 518,region: 'Oceania',},{name: 'Toronto',lng: -79.3832,lat: 43.6532,gdp: 324,population: 294,region: 'North America',},{name: 'Seoul',lng: 126.978,lat: 37.5665,gdp: 779,population: 969,region: 'Asia',},{name: 'Singapore',lng: 103.8198,lat: 1.3521,gdp: 340,population: 584,region: 'Asia',},{name: 'Chicago',lng: -87.6298,lat: 41.8781,gdp: 689,population: 271,region: 'North America',},{name: 'Frankfurt',lng: 8.6821,lat: 50.1109,gdp: 731,population: 75,region: 'Europe',},{name: 'Hong Kong',lng: 114.1694,lat: 22.3193,gdp: 365,population: 745,region: 'Asia',},{name: 'Mumbai',lng: 72.8777,lat: 19.076,gdp: 310,population: 1284,region: 'Asia',},{name: 'São Paulo',lng: -46.6333,lat: -23.5505,gdp: 430,population: 1252,region: 'South America',},{name: 'Mexico City',lng: -99.1332,lat: 19.4326,gdp: 411,population: 912,region: 'North America',},].map((city) => ({...city,// Data validation and formattingname: city.name || 'Unknown City',lng: typeof city.lng === 'number' ? city.lng : 0,lat: typeof city.lat === 'number' ? city.lat : 0,gdp: typeof city.gdp === 'number' ? city.gdp : 0,population: typeof city.population === 'number' ? city.population : 0,region: city.region || 'Unknown Region',}));// Simplified global map outline dataconst worldOutline = [{type: 'Feature',geometry: {type: 'Polygon',coordinates: [[[-180, -60],[180, -60],[180, 75],[-180, 75],[-180, -60],],],},},];const chart = new Chart({container: 'container',autoFit: true,});chart.options({type: 'geoView',children: [{type: 'geoPath',data: worldOutline,style: {fill: '#f0f0f0',stroke: '#d0d0d0',lineWidth: 1,},},{type: 'point',data: worldCities,encode: {x: 'lng',y: 'lat',size: 'gdp',color: 'region',shape: 'point',},style: {opacity: 0.8,stroke: 'white',lineWidth: 2,},scale: {size: {range: [8, 40],},color: {range: ['#1f77b4','#ff7f0e','#2ca02c','#d62728','#9467bd','#8c564b',],},},tooltip: {title: 'name',items: [{name: 'GDP',channel: 'size',valueFormatter: (value) => `${value || 0} billion USD`,},{name: 'Population',field: 'population',valueFormatter: (value) => `${value || 0} million`,},{ name: 'Region', field: 'region' },],},},],});chart.render();
Essential elements for creating bubble maps with G2 5.0:
type: 'geoView'type: 'point' in children to draw bubblesx, y to longitude and latitude coordinates in the encode objectsize to numeric valuescolor to categories or valuesstyle objectscale objecttooltip and labels to enhance user experiencechildren array to simultaneously draw map background and bubble layersFor actual applications, to properly display map backgrounds, you need to: