Bubble Chart
Previous
Bar Chart
Next
Color Map
Loading...

A bubble chart is a multivariate chart that is a variant of scatter plots and can also be considered a combination of scatter plots and percentage area charts.
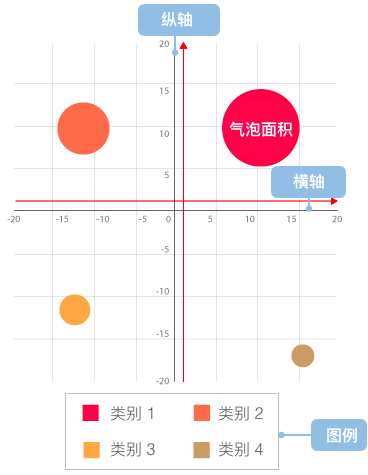
The most basic use of bubble charts is to use three values to determine each data series. Like scatter plots, bubble charts map two-dimensional data values to coordinate points on a Cartesian coordinate system, where the X and Y axis represent different two dimensions of data. However, unlike scatter plots, each bubble in a bubble chart has categorical information (they are displayed next to points or as legends). The area of each bubble represents the third numerical data. Additionally, different colors can be used to distinguish categorical data or other numerical data, or brightness or transparency can be used. When representing time-dimensional data, the time dimension can be used as one dimension in the rectangular coordinate system, or combined with animation to show how data changes over time.
Bubble charts are typically used to compare and display relationships between different categories of dots (which we call bubbles here) through the position and area size of bubbles. From an overall perspective, bubble charts can be used to analyze correlations in data.
It should be noted that bubble charts have limited data size capacity, as too many bubbles will make the chart difficult to read. However, this can be compensated by adding some interactive behaviors: hiding some information and displaying it when the mouse clicks or hovers, or adding an option to reorganize or filter grouping categories.
Additionally, the size of bubbles is mapped to area rather than radius or diameter. This is because if it were based on radius or diameter, the size of circles would not only change exponentially but also lead to visual errors.
Other Names: Bubble Chart
| Chart Type | Basic Bubble Chart |
|---|---|
| Suitable Data | Multidimensional data: at least two continuous data fields (X, Y axis) and one numerical data field (bubble size) |
| Function | Display relationships between multiple variables, discover data patterns and correlations |
| Data-to-Visual Mapping | Two continuous variables mapped to XY coordinates Third variable mapped to bubble size Optional categorical variable mapped to bubble color or shape |
| Suitable Data Count | Usually not exceeding 100 data points; too many will lead to chart crowding |
| Visual Design Suggestions | Use semi-transparent bubbles to avoid overlap occlusion Bubble size range should be moderate, avoiding too large or too small Add grid lines to assist in reading coordinate values |

| Chart Type | Logarithmic Bubble Chart |
|---|---|
| Suitable Data | Datasets with extreme value differences requiring logarithmic transformation |
| Function | Handling data with large spans, such as population data, GDP data, etc. |
| Data-to-Visual Mapping | Same as basic bubble chart but using logarithmic scale Two continuous variables mapped to XY coordinates Third variable mapped to bubble size through logarithmic transformation |
| Usage Scenario | When data exhibits exponential growth or value ranges spanning multiple orders of magnitude |
| Implementation Method | Using scale: { size: { type: 'log', range: [4, 20] } } to configure logarithmic scale |
| Considerations | Should clearly indicate the use of logarithmic transformation in legends or labels to avoid misleading readers |
Bubble charts are most suitable for the following scenarios:
The following chart shows the relationship between GDP per capita, life expectancy, and population size of different countries, while using colors to distinguish different continents, effectively presenting four dimensions of data in one chart.
| country | GDP (per capita) | lifeExpectancy | population | continent |
|---|---|---|---|---|
| China | 12547 | 76.9 | 1403500365 | Asia |
| United States | 59532 | 78.5 | 321773631 | Americas |
| India | 6427 | 68.3 | 1324517249 | Asia |
| Japan | 38428 | 83.9 | 127141000 | Asia |
| Germany | 46136 | 81.0 | 82695000 | Europe |
| ... | ... | ... | ... | ... |
| ```js | ob { inject: true } |
import { Chart } from '@antv/g2';
const chart = new Chart({ container: 'container', theme: 'classic', });
chart.options({ type: 'point', autoFit: true, data: { type: 'fetch', value: 'https://gw.alipayobjects.com/os/antvdemo/assets/data/bubble.json', }, encode: { x: 'GDP', y: 'LifeExpectancy', size: 'Population', color: 'continent', shape: 'point' }, scale: { size: { type: 'log', range: [4, 20] } }, style: { fillOpacity: 0.3, lineWidth: 1 }, legend: { size: false } });
chart.render();
**Analysis**:- The `GDP` field is mapped to the X axis, representing a country's GDP per capita, showing that developed countries are concentrated on the right- The `LifeExpectancy` field is mapped to the Y axis, representing citizens' life expectancy, allowing observation of a positive correlation between GDP per capita and life expectancy- The `Population` field is mapped to bubble size, processed with a logarithmic scale, making populous countries like China and India clearly visible- The `continent` field is mapped to color, showing the cluster distribution of countries from different continents**Insights**: Through this chart, we can intuitively observe:1. A positive correlation between economic level and health level2. No necessary connection between population size and economic development3. Differences in development patterns among countries from different continents### Unsuitable Use CasesExample 1: **Too Many Data Points or Excessive Bubble Overlap**When data points exceed 100 or bubbles seriously overlap, bubble charts may become chaotic and difficult to read. In such cases, consider using heat maps or faceted charts.Below is an example of a bubble chart with numerous data points; as the number of data points increases, the overlap between bubbles makes the chart difficult to interpret:```js | ob { inject: true }import { Chart } from '@antv/g2';const chart = new Chart({container: 'container',theme: 'classic',});// Generate 200 random data pointsconst data = Array.from({ length: 200 }, () => ({x: Math.random() * 100,y: Math.random() * 100,size: Math.random() * 20 + 5,category: ['A', 'B', 'C', 'D'][Math.floor(Math.random() * 4)]}));chart.options({type: 'point',autoFit: true,data,encode: {x: 'x',y: 'y',size: 'size',color: 'category'},style: {fillOpacity: 0.3,lineWidth: 1},});chart.render();
Example 2: Only Two Variables Need Comparison
When only comparing the relationship between two variables, a scatter plot is more concise and effective than a bubble chart. The third variable (bubble size) in a bubble chart, if unnecessary, would increase cognitive burden.
Example 3: Displaying Time Series Trend Data
Bubble charts are not suitable for displaying time series trend data. For data that needs to show trends over time, line charts or area charts are better choices.
Below is an example using a line chart instead of a bubble chart to display time series data:
import { Chart } from '@antv/g2';const chart = new Chart({container: 'container',theme: 'classic',});chart.options({type: 'view',autoFit: true,data: [{ day: '2015/9/1', share: 10, volume: 1200 },{ day: '2015/9/5', share: 20, volume: 2100 },{ day: '2015/9/10', share: 32, volume: 3400 },{ day: '2015/9/15', share: 45, volume: 2900 },{ day: '2015/9/20', share: 51, volume: 4100 },{ day: '2015/9/25', share: 45, volume: 3800 },{ day: '2015/9/30', share: 40, volume: 2700 },],encode: { x: 'day', y: 'share' },axis: {y: {title: 'Stock Price',},x: {title: 'Date',},},children: [{type: 'line',style: {lineWidth: 3,},},],});chart.render();
If a third dimension of information is indeed needed in time series data, you can use a time series bubble chart with size encoding:
import { Chart } from '@antv/g2';const chart = new Chart({container: 'container',theme: 'classic',});chart.options({type: 'point',autoFit: true,data: [{ day: '2015/9/1', share: 10, volume: 1200 },{ day: '2015/9/5', share: 20, volume: 2100 },{ day: '2015/9/10', share: 32, volume: 3400 },{ day: '2015/9/15', share: 45, volume: 2900 },{ day: '2015/9/20', share: 51, volume: 4100 },{ day: '2015/9/25', share: 45, volume: 3800 },{ day: '2015/9/30', share: 40, volume: 2700 },],encode: {x: 'day',y: 'share',size: 'volume',},scale: {size: { range: [10, 40] },},style: {fillOpacity: 0.6,stroke: '#1890ff',fill: '#1890ff',},axis: {y: { title: 'Stock Price' },x: { title: 'Date' },},});chart.render();
| Chart Type | Main Features | Suitable Scenarios | Data Dimensions |
|---|---|---|---|
| Bubble Chart | Encodes additional dimension through point size | Multivariate relationship analysis | 3-4 variables (X, Y, size, color) |
| Scatter Plot | Only displays point positions | Two-dimensional correlation analysis | 2-3 variables (X, Y, color) |
| Heat Map | Displays density or value through color intensity | Showing distribution density | 3 variables (X, Y, color intensity) |
| Chart Type | Coordinate System | Data Constraints | Application Scenarios |
|---|---|---|---|
| Bubble Chart | Abstract coordinate system | Can use any values as XY coordinates | Multidimensional data relationship visualization |
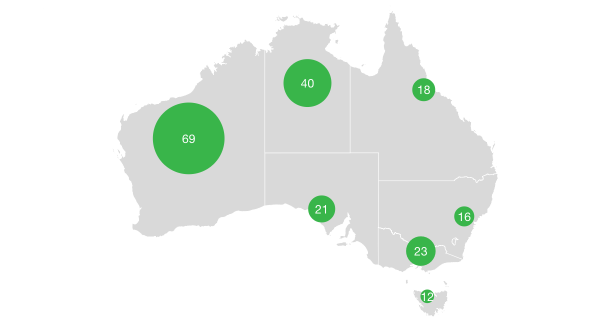
| Bubble Map | Geographic coordinate system | Point positions constrained by geographic coordinates | Multivariate analysis in geographic data |
| Scatter Map | Geographic coordinate system | Point positions constrained by geographic coordinates | Simple distribution of geographic locations |