
Server-Side Rendering (SSR)
Previous
Set pattern
Next
Spec Function Expression Support (Available in 5.3.0)
Loading...
Server-Side Rendering (SSR) refers to rendering charts in non-browser environments, as opposed to Client-Side Rendering (CSR). This typically occurs in backend languages like Node.js, Python, Java, PHP, etc., producing static images without interactivity or animations. Common use cases include:
Frontend data visualization libraries are built upon browser DOM Canvas APIs. To render charts in Node.js, we need to replace the DOM Canvas with Node Canvas. In the Node.js ecosystem, node-canvas provides a Cairo-based implementation of the Canvas2D API that aligns with browser standards.
By leveraging node-canvas and AntV's G2 (which supports custom Canvas objects), we can switch to Node.js rendering engines for server-side chart generation.
Online Example - Note: jsdom-based solutions can only generate SVG. For PNG-like formats, use node-canvas.
Firstly, create two node-canvases, one for rendering the scene and the other for measuring text width:
const { createCanvas } = require('canvas');const nodeCanvas = createCanvas(width, height);const offscreenNodeCanvas = createCanvas(1, 1);
Then create a canvas renderer and canvas:
import { Canvas } from '@antv/g';import { Renderer } from '@antv/g-canvas';const renderer = new Renderer();// Omitting the removal of DOM-related plugin code.const gCanvas = new Canvas({width,height,canvas: nodeCanvas,renderer,offscreenCanvas: offscreenNodeCanvas,});
Next, create a G2 Chart as usual and render it. After completion, use the createPNGStream method provided by node-canvas to create a ReadableStream containing the PNG encoding. Similarly, createJPEGStream and createPDFStream are also available for exporting JPEG and PDF, respectively.
function writePNG(nodeCanvas) {return new Promise<string>((resolve, reject) => {const f = path.join(os.tmpdir(), `${Math.random()}.png`);const out = fs.createWriteStream(f);const stream = nodeCanvas.createPNGStream();stream.pipe(out);out.on('finish', () => resolve(f)).on('error', reject);});}
We've packaged the SSR solution into a ready-to-use library: @antv/g2-ssr.
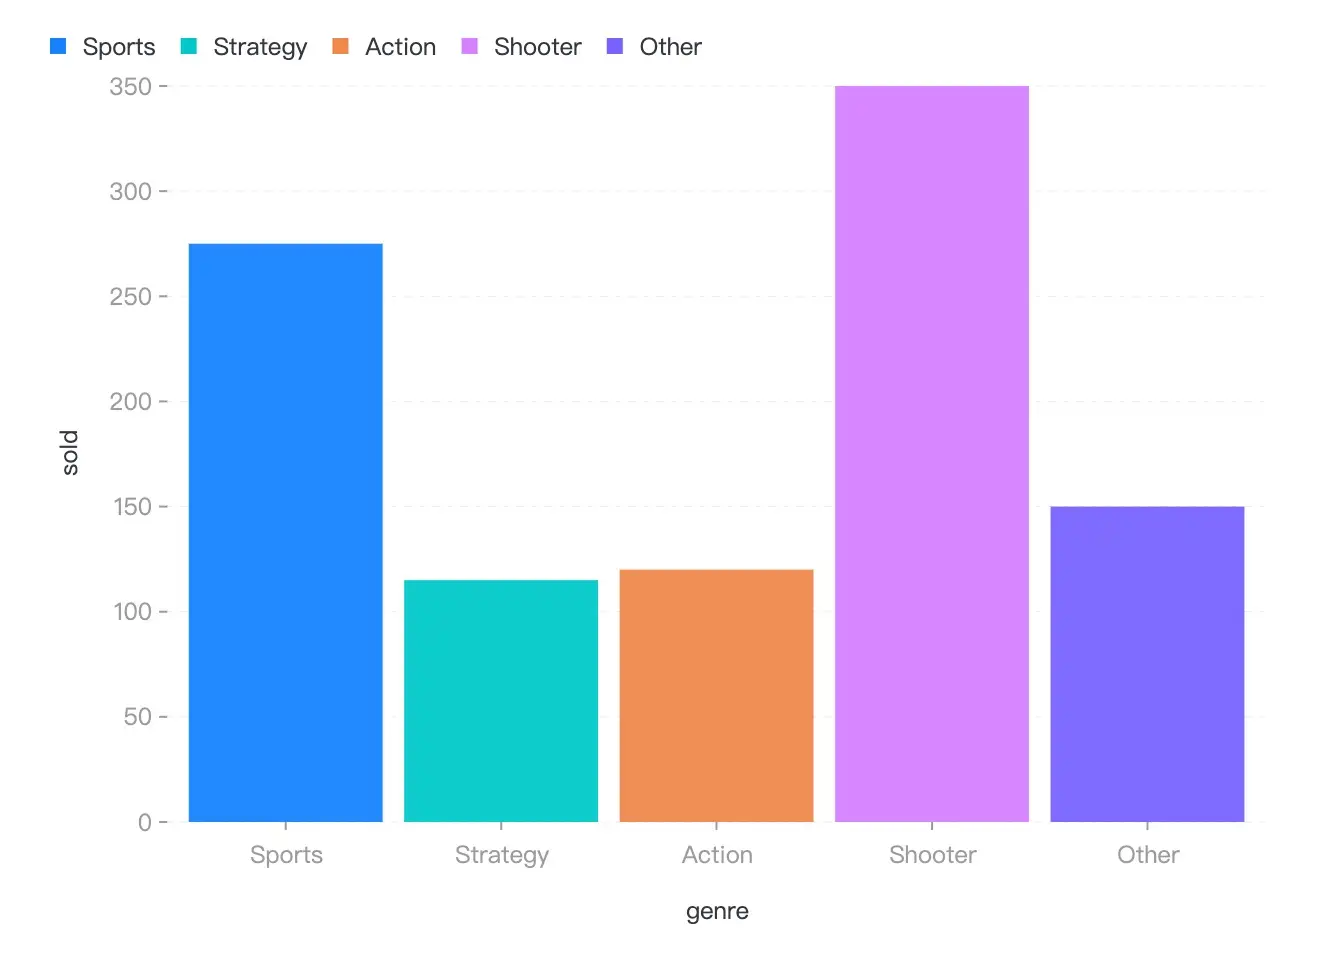
const chart = await createChart({width: 640,height: 480,imageType: 'png', // or 'jpeg'// Other G2 configurations (refer to G2 docs)type: 'interval',data: [{ genre: 'Sports', sold: 275 },{ genre: 'Strategy', sold: 115 },{ genre: 'Action', sold: 120 },{ genre: 'Shooter', sold: 350 },{ genre: 'Other', sold: 150 },],encode: {x: 'genre',y: 'sold',color: 'genre',},});// Exportchart.exportToFile('chart'); // -> chart.pngchart.toBuffer(); // -> get buffer
Renders in ~400ms with browser-equivalent quality:
We've open-sourced an AI-oriented visualization solution leveraging this SSR capability: mcp-server-chart. It interprets AI model outputs and user intent to generate visualizations, currently supporting 15+ chart types and relational diagrams.

Because the code of G2 is written and developed in JavaScript, it cannot be used directly in Python, Java, PHP and other language environments. However, you can install the Node.JS environment in the service and then use the corresponding back-end language command line API to drive the above-mentioned Node.JS code to perform SSR.
Refer to python calls node js, other languages are similar.