
南丁格尔玫瑰图
上一篇
散点图
下一篇
仪表盘
Loading...
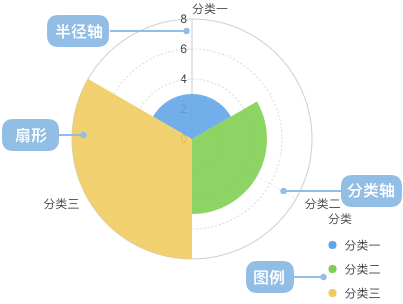
南丁格尔玫瑰图(又名鸡冠花图、极坐标区域图),是南丁格尔在克里米亚战争期间提交的一份关于士兵死伤的报告时发明的一种图表。
南丁格尔玫瑰图是在极坐标下绘制的柱状图,使用圆弧的半径长短表示数据的大小(数量的多少)。
其他名称:Nightingale Rose Chart, Coxcomb Chart, Polar Area Diagram
| 图表类型 | 南丁格尔玫瑰图 |
|---|---|
| 适合的数据 | 列表:一个分类数据字段、一个连续数据字段 |
| 功能 | 对比分类数据的数值大小 |
| 数据与图形的映射 | 分类数据字段映射到分类轴的位置 连续数据字段映射到半径轴的高度 分类数据也可以设置颜色增强分类的区分度 |
| 适合的数据条数 | 不超过 30 条数据 |
例子 1: 对比不同分类的大小
下图是各国制造指数的对比,以美国为基准(100),中国的制造成本指数是 96,也就是说,同样一件产品,在美国制造成本是 1 美元,那么在中国则需要 0.96 美元,从下图可以看出中国的制造优势已经不明显。
| country(国家) | cost(制造指数) |
|---|---|
| 中国 | 96 |
| 德国 | 121 |
| 美国 | 100 |
| 日本 | 111 |
| 韩国 | 102 |
| ... | ... |
import { Chart } from '@antv/g2';const chart = new Chart({container: 'container',theme: 'classic',});chart.options({type: 'interval',autoFit: true,coordinate: { type: 'polar' },data: [{ country: '中国', cost: 96 },{ country: '德国', cost: 121 },{ country: '美国', cost: 100 },{ country: '日本', cost: 111 },{ country: '韩国', cost: 102 },{ country: '法国', cost: 124 },{ country: '意大利', cost: 123 },{ country: '荷兰', cost: 111 },{ country: '比利时', cost: 123 },{ country: '英国', cost: 109 },{ country: '加拿大', cost: 115 },{ country: '俄罗斯', cost: 99 },{ country: '墨西哥', cost: 91 },{ country: '印度', cost: 87 },{ country: '瑞士', cost: 125 },{ country: '澳大利亚', cost: 130 },{ country: '西班牙', cost: 109 },{ country: '巴西', cost: 123 },{ country: '泰国', cost: 91 },{ country: '印尼', cost: 83 },{ country: '波兰', cost: 101 },{ country: '瑞典', cost: 116 },{ country: '奥地利', cost: 111 },{ country: '捷克', cost: 107 },],encode: {x: 'country',y: 'cost',color: 'country',},scale: {y: { nice: true },color: { palette: 'category20' },},axis: {y: { labelFormatter: null },x: { grid: true },},interaction: [{type: 'elementHighlight',background: true,},],});chart.render();
例子 1: 分类过少的场景
下图展示一个班级男女同学的个数,这种场景下使用玫瑰图和饼图的对比。当分类很少时,饼图比玫瑰图更适合。
| gender(性别) | count(人数) |
|---|---|
| 男 | 40 |
| 女 | 30 |
import { Chart } from '@antv/g2';const chart1 = new Chart({container: 'container',theme: 'classic',});chart1.options({type: 'interval',autoFit: true,coordinate: {type: 'polar',},data: [{ gender: '男', count: 40 },{ gender: '女', count: 30 },],encode: {x: 'gender',y: 'count',color: 'gender',},scale: {y: { nice: true, min: 0 },color: { range: ['#4F81BD', '#70AD47'] },},style: {stroke: 'white',lineWidth: 1,},axis: {y: {grid: true,labelFormatter: (val) => `${val}`,},},title: '玫瑰图',});chart1.render();
import { Chart } from '@antv/g2';const chart2 = new Chart({container: 'container',theme: 'classic',});chart2.options({type: 'interval',autoFit: true,coordinate: { type: 'theta' },data: [{ gender: '男', count: 40 },{ gender: '女', count: 30 },],encode: {color: 'gender',y: 'count',},style: {stroke: 'white',lineWidth: 1,},title: '饼图',});chart2.render();
例子 2: 分类数值相差悬殊的场景
下面使用南丁格尔玫瑰图和横向柱状图分别展示各个省份的人口数据,这种场景下使用玫瑰图不合适,原因是在玫瑰图中数值相差悬殊的分类会导致较小数值的分类难以观察。推荐使用横向柱状图。
| province(省份) | population(人口数量) |
|---|---|
| 北京市 | 19,612,368 |
| 天津市 | 12,938,693 |
| 河北省 | 71,854,210 |
| 山西省 | 27,500,000 |
| ... | ... |
南丁格尔玫瑰图(不推荐)
import { Chart } from '@antv/g2';const chart = new Chart({container: 'container',theme: 'classic',});chart.options({type: 'interval',autoFit: true,coordinate: { type: 'polar' },data: [{ province: '北京市', population: 19612368 },{ province: '天津市', population: 12938693 },{ province: '河北省', population: 71854210 },{ province: '山西省', population: 27500000 },{ province: '内蒙古自治区', population: 24706291 },{ province: '辽宁省', population: 43746323 },{ province: '吉林省', population: 27452815 },{ province: '黑龙江省', population: 38313991 },{ province: '上海市', population: 23019196 },{ province: '江苏省', population: 78660941 },{ province: '浙江省', population: 54426891 },{ province: '安徽省', population: 59500468 },{ province: '福建省', population: 36894217 },{ province: '江西省', population: 44567797 },{ province: '山东省', population: 95792719 },{ province: '河南省', population: 94029939 },{ province: '湖北省', population: 57237727 },{ province: '湖南省', population: 65700762 },{ province: '广东省', population: 104320459 },{ province: '广西壮族自治区', population: 46023761 },{ province: '海南省', population: 8671485 },{ province: '重庆市', population: 28846170 },{ province: '四川省', population: 80417528 },{ province: '贵州省', population: 34748556 },{ province: '云南省', population: 45966766 },{ province: '西藏自治区', population: 3002165 },{ province: '陕西省', population: 37327379 },{ province: '甘肃省', population: 25575263 },{ province: '青海省', population: 5626723 },],encode: {x: 'province',y: 'population',color: 'province',},scale: {y: { nice: true },color: { palette: 'category20' },},axis: {y: { labelFormatter: null },x: {labelFormatter: (text) =>text.length > 3 ? text.slice(0, 3) + '...' : text,labelRotate: Math.PI / 4,},},title: '南丁格尔玫瑰图(不推荐)',});chart.render();
横向柱状图(推荐)
import { Chart } from '@antv/g2';const data = [{ province: '北京市', population: 19612368 },{ province: '天津市', population: 12938693 },{ province: '河北省', population: 71854210 },{ province: '山西省', population: 27500000 },{ province: '内蒙古自治区', population: 24706291 },{ province: '辽宁省', population: 43746323 },{ province: '吉林省', population: 27452815 },{ province: '黑龙江省', population: 38313991 },{ province: '上海市', population: 23019196 },{ province: '江苏省', population: 78660941 },{ province: '浙江省', population: 54426891 },{ province: '安徽省', population: 59500468 },{ province: '福建省', population: 36894217 },{ province: '江西省', population: 44567797 },{ province: '山东省', population: 95792719 },{ province: '河南省', population: 94029939 },{ province: '湖北省', population: 57237727 },{ province: '湖南省', population: 65700762 },{ province: '广东省', population: 104320459 },{ province: '广西壮族自治区', population: 46023761 },{ province: '海南省', population: 8671485 },{ province: '重庆市', population: 28846170 },{ province: '四川省', population: 80417528 },{ province: '贵州省', population: 34748556 },{ province: '云南省', population: 45966766 },{ province: '西藏自治区', population: 3002165 },{ province: '陕西省', population: 37327379 },{ province: '甘肃省', population: 25575263 },{ province: '青海省', population: 5626723 },];const sortedData = [...data].sort((a, b) => b.population - a.population);const chart = new Chart({container: 'container',theme: 'classic',});chart.options({type: 'interval',autoFit: true,coordinate: { transform: [{ type: 'transpose' }] },data: sortedData.slice(0, 15), // 截取前15个,避免过多数据encode: {x: 'population',y: 'province',color: 'province',},scale: {x: { nice: true },color: { palette: 'category20' },},axis: {x: {title: '人口数量',labelFormatter: (val) => {return (val / 1000000).toFixed(1) + 'M';},},y: {title: '省份',labelFormatter: (text) =>text.length > 5 ? text.slice(0, 5) + '...' : text,},},legend: false,title: '横向柱状图(推荐)',style: {fillOpacity: 0.85,},animate: {enter: { type: 'growInX' },},});chart.render();
例子 3: 部分分类数值过小的场景
下图展示了某个班级的各科及格率,使用南丁格尔玫瑰图和横向柱状图分别展示。这种场景由于存在部分分类数值过小的情况,使用南丁格尔玫瑰图会导致图形扭曲,不易于观察数据的真实比例关系。
| 科目 | 及格率 |
|---|---|
| 数学 | 98% |
| 英语 | 95% |
| 物理 | 60% |
| 化学 | 55% |
| 生物 | 30% |
| 地理 | 5% |
import { Chart } from '@antv/g2';const chart1 = new Chart({container: 'container',theme: 'classic',});chart1.options({type: 'interval',autoFit: true,coordinate: { type: 'polar' },data: [{ subject: '数学', pass: 98 },{ subject: '英语', pass: 95 },{ subject: '物理', pass: 60 },{ subject: '化学', pass: 55 },{ subject: '生物', pass: 30 },{ subject: '地理', pass: 5 },],encode: {x: 'subject',y: 'pass',color: 'subject',},scale: {y: { nice: true, min: 0 },color: { range: ['#4F81BD', '#70AD47', '#F79646', '#A9A9A9', '#C0504D'] },},style: {stroke: 'white',lineWidth: 1,},axis: {y: {grid: true,labelFormatter: (val) => `${val}`,},},title: '南丁格尔玫瑰图(不推荐)',});chart1.render();
import { Chart } from '@antv/g2';const chart2 = new Chart({container: 'container',theme: 'classic',});chart2.options({type: 'interval',autoFit: true,coordinate: { transform: [{ type: 'transpose' }] },data: [{ subject: '数学', pass: 98 },{ subject: '英语', pass: 95 },{ subject: '物理', pass: 60 },{ subject: '化学', pass: 55 },{ subject: '生物', pass: 30 },{ subject: '地理', pass: 5 },],encode: {x: 'subject',y: 'pass',color: 'subject',},scale: {y: { nice: true, min: 0 },color: { range: ['#4F81BD', '#70AD47', '#F79646', '#A9A9A9', '#C0504D'] },},style: {stroke: 'white',lineWidth: 1,},axis: {y: {grid: true,labelFormatter: (val) => `${val}`,},},title: '横向柱状图(推荐)',});chart2.render();
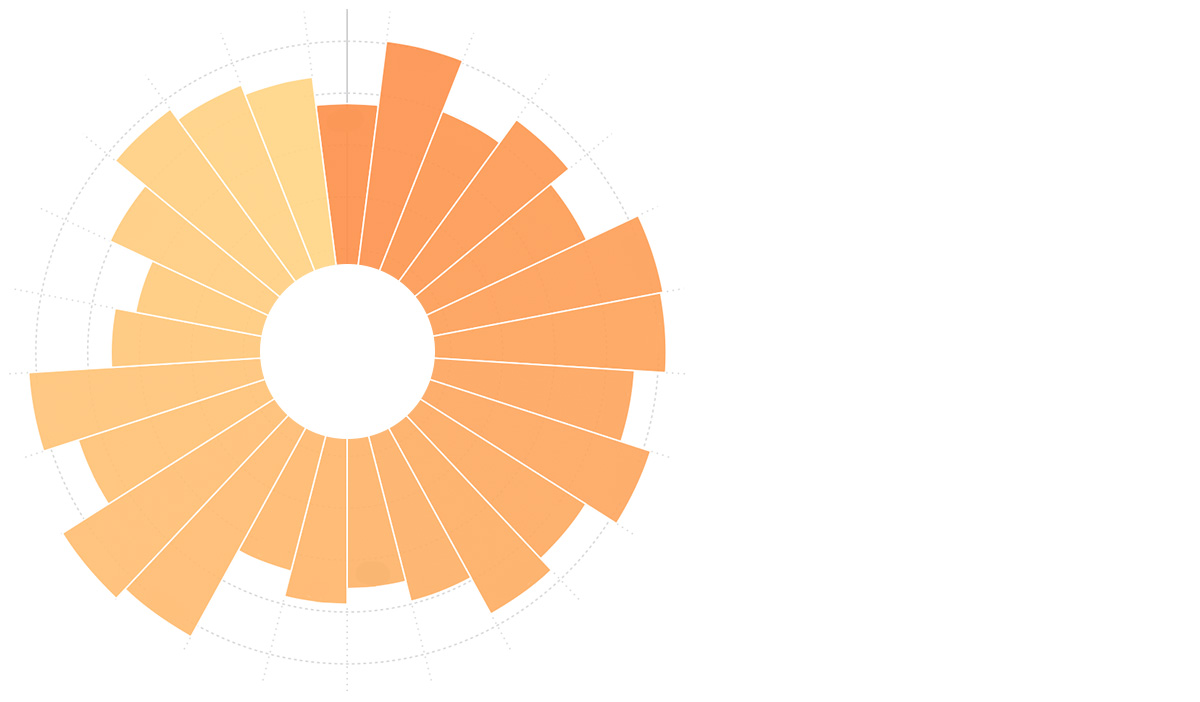
通过设置极坐标的起始角度可以实现扇形南丁格尔玫瑰图:
import { Chart } from '@antv/g2';const chart = new Chart({container: 'container',theme: 'classic',});chart.options({type: 'interval',autoFit: true,coordinate: {type: 'polar',startAngle: Math.PI,endAngle: Math.PI * (3 / 2),},data: [{ country: '中国', cost: 96 },{ country: '德国', cost: 121 },{ country: '美国', cost: 100 },{ country: '日本', cost: 111 },{ country: '韩国', cost: 102 },{ country: '法国', cost: 124 },{ country: '意大利', cost: 123 },{ country: '荷兰', cost: 111 },{ country: '比利时', cost: 123 },{ country: '英国', cost: 109 },{ country: '加拿大', cost: 115 },{ country: '俄罗斯', cost: 99 },],encode: {x: 'country',y: 'cost',color: 'country',},scale: {y: { nice: true },color: { range: ['#fc8f48', '#ffd787'] },},style: {lineWidth: 1,stroke: '#fff',},labels: [{text: 'cost',style: {textAlign: 'center',fontSize: 10,fontWeight: 'bold',},transform: [{ type: 'overlapDodgeY' }],},],});chart.render();
南丁格尔玫瑰图的实现原理是将柱状图在极坐标下绘制,如果将柱状图扩展为层叠柱状图,同样可以实现层叠的玫瑰图。
下图是近十年来难民数据,其中大致可分为跨越国境的难民(refugees),未跨越国境的境内流离失所者(internally displaced persons)和尚未取得难民身份的寻求庇护者(asylum-seekers)。
| year(年份) | internally(境内流离失所者) | refugees(跨越国境的难民) | seekers(未取得难民身份) |
|---|---|---|---|
| 2000 | 21.0 | 16 | 0.8 |
| 2001 | 25.0 | 16 | 0.8 |
| ... | ... | ... | ... |
import { Chart } from '@antv/g2';const chart = new Chart({container: 'container',theme: 'classic',});chart.options({type: 'interval',autoFit: true,coordinate: {type: 'polar',innerRadius: 0.1,},data: [{ year: '2000', type: '境内流离失所者', count: 21.0 },{ year: '2000', type: '跨越国境的难民', count: 16 },{ year: '2000', type: '未取得难民身份', count: 0.8 },{ year: '2001', type: '境内流离失所者', count: 25.0 },{ year: '2001', type: '跨越国境的难民', count: 16 },{ year: '2001', type: '未取得难民身份', count: 0.8 },{ year: '2002', type: '境内流离失所者', count: 25.0 },{ year: '2002', type: '跨越国境的难民', count: 15 },{ year: '2002', type: '未取得难民身份', count: 0.8 },{ year: '2003', type: '境内流离失所者', count: 25.0 },{ year: '2003', type: '跨越国境的难民', count: 14 },{ year: '2003', type: '未取得难民身份', count: 0.7 },{ year: '2004', type: '境内流离失所者', count: 25.0 },{ year: '2004', type: '跨越国境的难民', count: 14 },{ year: '2004', type: '未取得难民身份', count: 0.7 },{ year: '2005', type: '境内流离失所者', count: 24.0 },{ year: '2005', type: '跨越国境的难民', count: 13 },{ year: '2005', type: '未取得难民身份', count: 0.8 },{ year: '2006', type: '境内流离失所者', count: 24.0 },{ year: '2006', type: '跨越国境的难民', count: 14 },{ year: '2006', type: '未取得难民身份', count: 0.7 },{ year: '2007', type: '境内流离失所者', count: 26.0 },{ year: '2007', type: '跨越国境的难民', count: 16 },{ year: '2007', type: '未取得难民身份', count: 0.7 },{ year: '2008', type: '境内流离失所者', count: 26.0 },{ year: '2008', type: '跨越国境的难民', count: 15.2 },{ year: '2008', type: '未取得难民身份', count: 0.8 },{ year: '2009', type: '境内流离失所者', count: 27.1 },{ year: '2009', type: '跨越国境的难民', count: 15.2 },{ year: '2009', type: '未取得难民身份', count: 1.0 },{ year: '2010', type: '境内流离失所者', count: 27.5 },{ year: '2010', type: '跨越国境的难民', count: 15.4 },{ year: '2010', type: '未取得难民身份', count: 0.8 },{ year: '2011', type: '境内流离失所者', count: 26.4 },{ year: '2011', type: '跨越国境的难民', count: 15.2 },{ year: '2011', type: '未取得难民身份', count: 0.9 },{ year: '2012', type: '境内流离失所者', count: 28.8 },{ year: '2012', type: '跨越国境的难民', count: 15.4 },{ year: '2012', type: '未取得难民身份', count: 0.9 },{ year: '2013', type: '境内流离失所者', count: 33.3 },{ year: '2013', type: '跨越国境的难民', count: 16.7 },{ year: '2013', type: '未取得难民身份', count: 1.2 },{ year: '2014', type: '境内流离失所者', count: 38.2 },{ year: '2014', type: '跨越国境的难民', count: 19.5 },{ year: '2014', type: '未取得难民身份', count: 1.8 },],encode: {x: 'year',y: 'count',color: 'type',},transform: [{ type: 'stackY' }],scale: {color: {range: ['rgb(136,186,174)', 'rgb(184,189,61)', 'rgb(107,136,138)'],},},style: {stroke: 'white',lineWidth: 1,},});chart.render();


