
双向柱状图
上一篇
箱形图
下一篇
饼图
Loading...
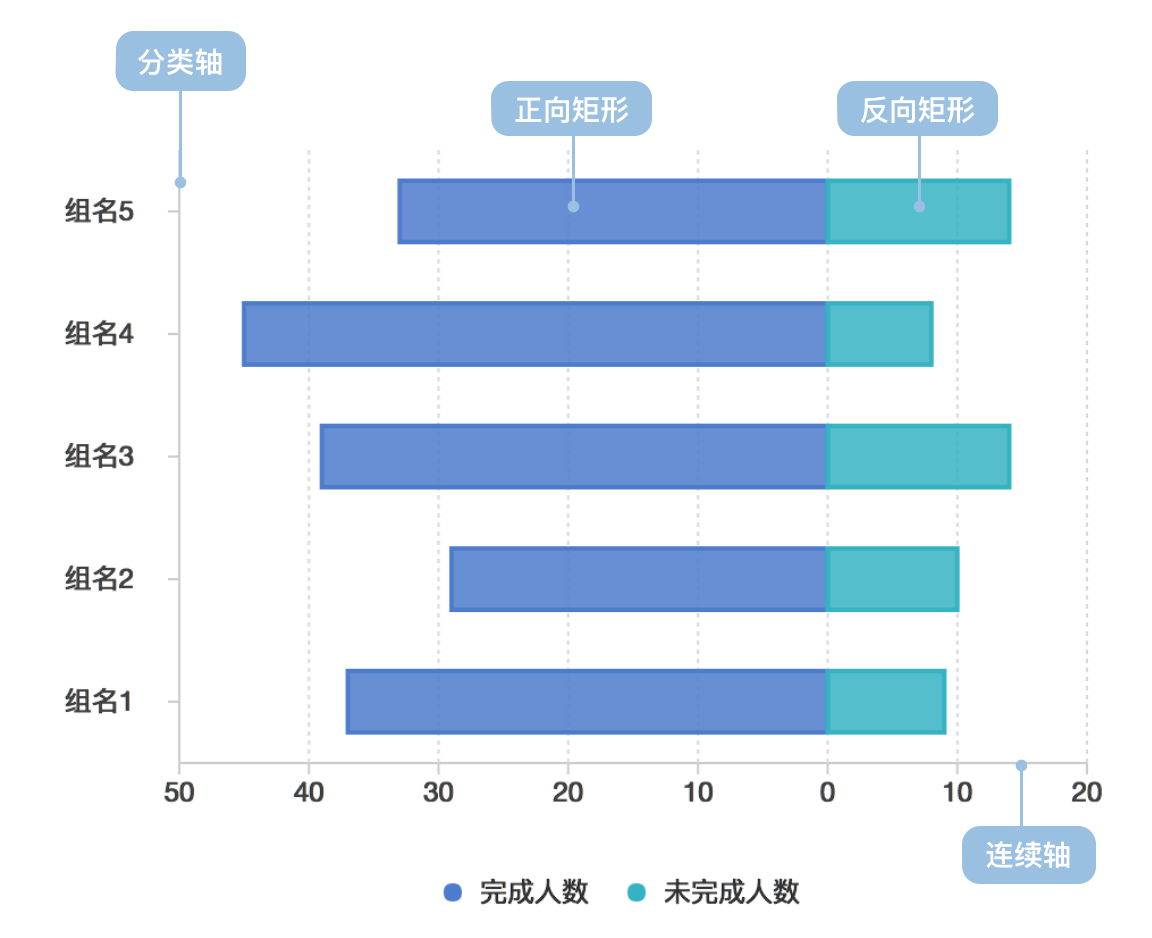
双向柱状图(又名正负条形图),使用正向和反向的柱子显示类别之间的数值比较。其中分类轴表示需要对比的分类维度,连续轴代表相应的数值,分为两种情况,一种是正向刻度值与反向刻度值完全对称,另一种是正向刻度值与反向刻度值反向对称,即互为相反数。
英文名:Bi-Directional Bar,Bi-Directional Column
| 图表类型 | 双向柱状图 |
|---|---|
| 适合的数据 | 列表:一个分类数据字段、两个连续数据字段 |
| 功能 | 对比分类数据的数值大小 |
| 数据与图形的映射 | 分类数据字段映射到分类轴的位置;一个连续数据字段映射到正向矩形的长度;另一个连续数据字段映射到反向矩形的长度;正反向数据可以设置颜色或形状(shape)增强区分度;分类数据可以设置颜色增强分类的区分度 |
| 适合的数据条数 | 横向不超过 30 条数据、纵向不超过 12 条数据 |
例子 1: 正反分类数据对比
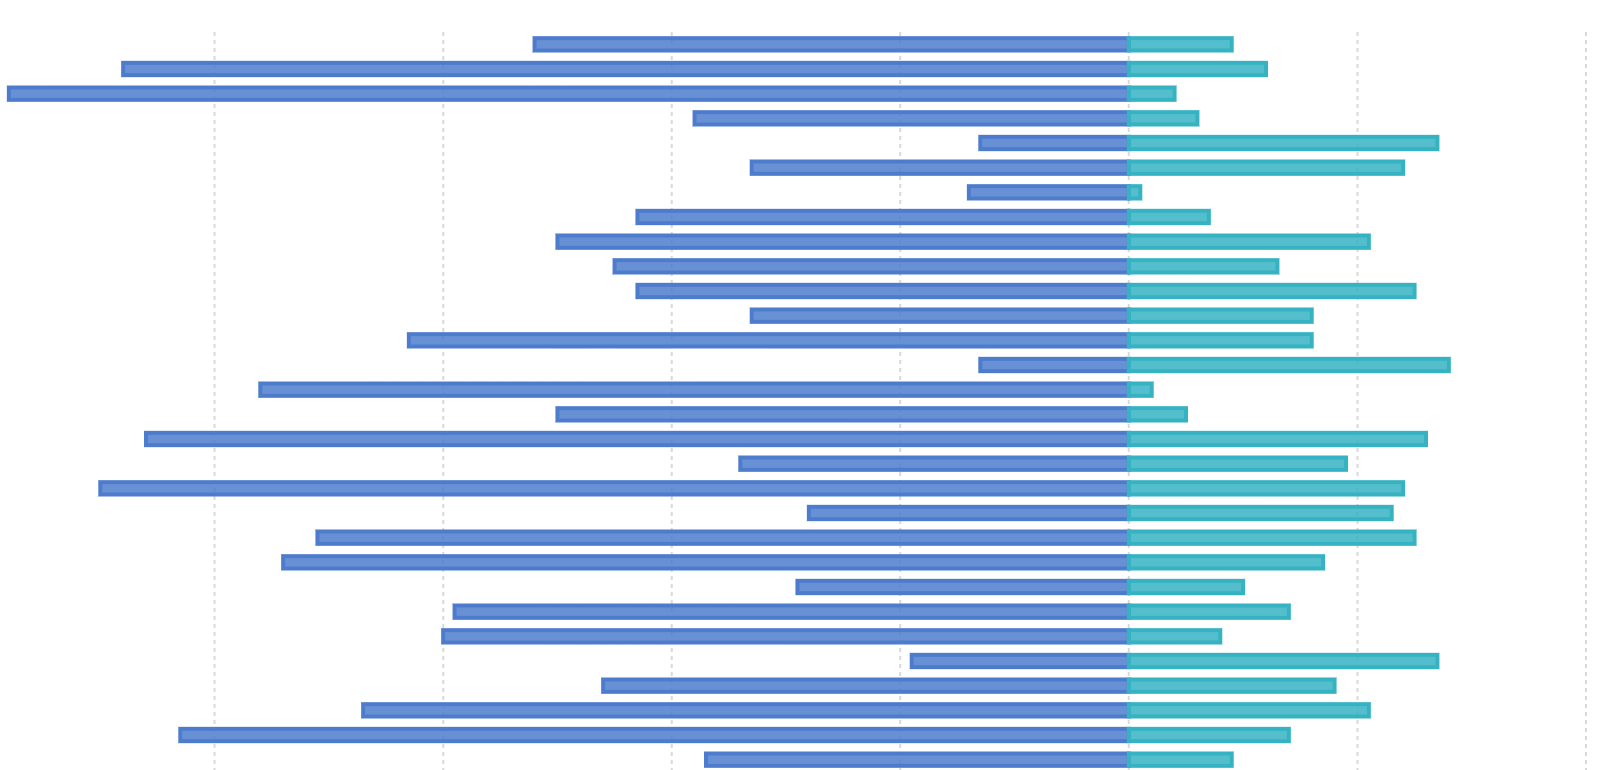
下图是模拟某个公司各个部门对某项任务的完成情况数据的对比图,完成人数使用正向柱状图表示、未完成人数使用反向柱状图表示。
| 部门 | 小组 | 完成人数 | 未完成人数 |
|---|---|---|---|
| 部门 0 | 组名 0 | 37 | 9 |
| ... | ... | ... | ... |
import { Chart } from '@antv/g2';const chart = new Chart({container: 'container',});const data = [{ department: '部门 0', group: '组名0', people: 37, type: 'completed' },{ department: '部门 0', group: '组名0', people: 9, type: 'uncompleted' },{ department: '部门 0', group: '组名1', people: 27, type: 'completed' },{ department: '部门 0', group: '组名1', people: 10, type: 'uncompleted' },{ department: '部门 1', group: '组名2', people: 37, type: 'completed' },{ department: '部门 1', group: '组名2', people: 19, type: 'uncompleted' },{ department: '部门 1', group: '组名3', people: 37, type: 'completed' },{ department: '部门 1', group: '组名3', people: 29, type: 'uncompleted' },{ department: '部门 2', group: '组名4', people: 20, type: 'completed' },{ department: '部门 2', group: '组名4', people: 2, type: 'uncompleted' },{ department: '部门 2', group: '组名5', people: 40, type: 'completed' },{ department: '部门 2', group: '组名5', people: 10, type: 'uncompleted' },{ department: '部门 3', group: '组名6', people: 25, type: 'completed' },{ department: '部门 3', group: '组名6', people: 3, type: 'uncompleted' },{ department: '部门 3', group: '组名7', people: 55, type: 'completed' },{ department: '部门 3', group: '组名7', people: 8, type: 'uncompleted' },];const range = ['#7593ed', '#95e3b0', '#6c7893', '#e7c450', '#7460eb'];chart.options({type: 'interval',coordinate: { transform: [{ type: 'transpose' }] },autoFit: true,data: data,encode: {x: 'group',y: (d) => (d.type === 'completed' ? d.people : -d.people),color: 'department',},scale: {x: { padding: 0.5 },color: {type: 'ordinal',range,},},axis: {x: { title: '' },y: {labelFormatter: (d) => {return Math.abs(d);},},},style: {fill: ({ type }, i, data) => {if (type === 'uncompleted') {return 'transparent';}},stroke: (d, i, data, ...re) => {const { type } = d;if (type === 'uncompleted') {return range[i / 2];}},lineWidth: 2,},tooltip: {title: (d) => {return `${d.department}-${d.group}`;},items: [(d, i, data, column) => ({name: d.type === 'completed' ? '完成' : '未完成',value: d.people,}),],},});chart.render();
说明 :
颜色用于区分不同的部门形状(空心和实心)用于区分完成人数和未完成人数位置用于区分不同小组双向柱状图不适合不含相反含义的数据
例子 1: 层叠双向柱状图
下图展示了不同类型的人群对某个问题的同意程度的统计数据,分为非常不同意、不同意、没意见、同意和非常同意五种程度,其中非常不同意、不同意和没意见作为反向柱状图,不同程度用不同颜色来表示。虚构数据
| type | Strongly agree | Agree | Neither agree nor disagree | Disagree | Strongly disagree |
|---|---|---|---|---|---|
| Question 1 | 11.7 | 59.9 | 18.5 | 9.1 | 0.7 |
| ... | ... | ... | ... | ... | ... |
import { Chart } from '@antv/g2';const chart = new Chart({container: 'container',});const types = ['Strongly disagree','Disagree','Neither agree nor disagree','Agree','Strongly agree',];const colors = ['#c30d24', '#f3a583', '#cccccc', '#94c6da', '#1770ab'];chart.options({type: 'interval',coordinate: { transform: [{ type: 'transpose' }] },autoFit: true,data: {type: 'fetch',value:'https://gw.alipayobjects.com/os/bmw-prod/82c97016-0f99-433b-ab21-9ecf14244610.csv',},transform: [{ type: 'stackY' }],encode: {x: 'question',y: (d) =>d.type === 'Disagree' || d.type === 'Strongly disagree'? -d.percentage: d.type === 'Neither agree nor disagree'? -d.percentage / 2: +d.percentage,color: 'type',},scale: {x: { padding: 0.5 },color: { domain: types, range: colors },},axis: {x: { title: '' },y: {labelFormatter: (d) => {return Math.abs(d);},},},tooltip: {items: [(d, i, data, column) => ({name: d.type,value: d.percentage,}),],},});chart.render();
说明 :
颜色用于区分不同程度位置用于区分不同问题


