---
title: "桑基图"
description: "用连接带宽度表达节点间的流量,了解桑基图在流程、能源和资金流向分析中的应用及 G2 示例。"
language: "zh"
canonical: "https://g2.antv.antgroup.com/zh/charts/sankey/"
version: "5.4.8"
---
 ## 桑基图的简介
桑基图 (Sankey Diagram),是一种特定类型的流图,用于描述一组值到另一组值的流向。上图为 1869 年,查尔斯米纳德(Charles Minard)绘制的 1812 年拿破仑征俄图(Map of Napolean's Russian Campaign of 1812),这是一个在地图上覆盖桑基图的流程图。1898 年爱尔兰人 Matthew Henry Phineas Riall Sankey 在土木工程师学会会报纪要的一篇关于蒸汽机能源效率的文章中首次推出了第一个能量流动图,此后便以其名字命名为 Sankey 图,中文音译为桑基图。
图中延伸的分支的宽度对应数据流量的大小。桑基图的特点如下:
- 起始流量和结束流量相同,所有主支宽度的总和与所有分出去的分支宽度总和相等,保持能量的平衡;
- 在内部,不同的线条代表了不同的流量分流情况,它的宽度成比例地显示此分支占有的流量;
- 节点不同的宽度代表了特定状态下的流量大小。
桑基图通常应用于能源、材料成分、金融等数据的可视化分析。
**英文名**:Sankey Diagram
## 桑基图的构成
### 基础桑基图
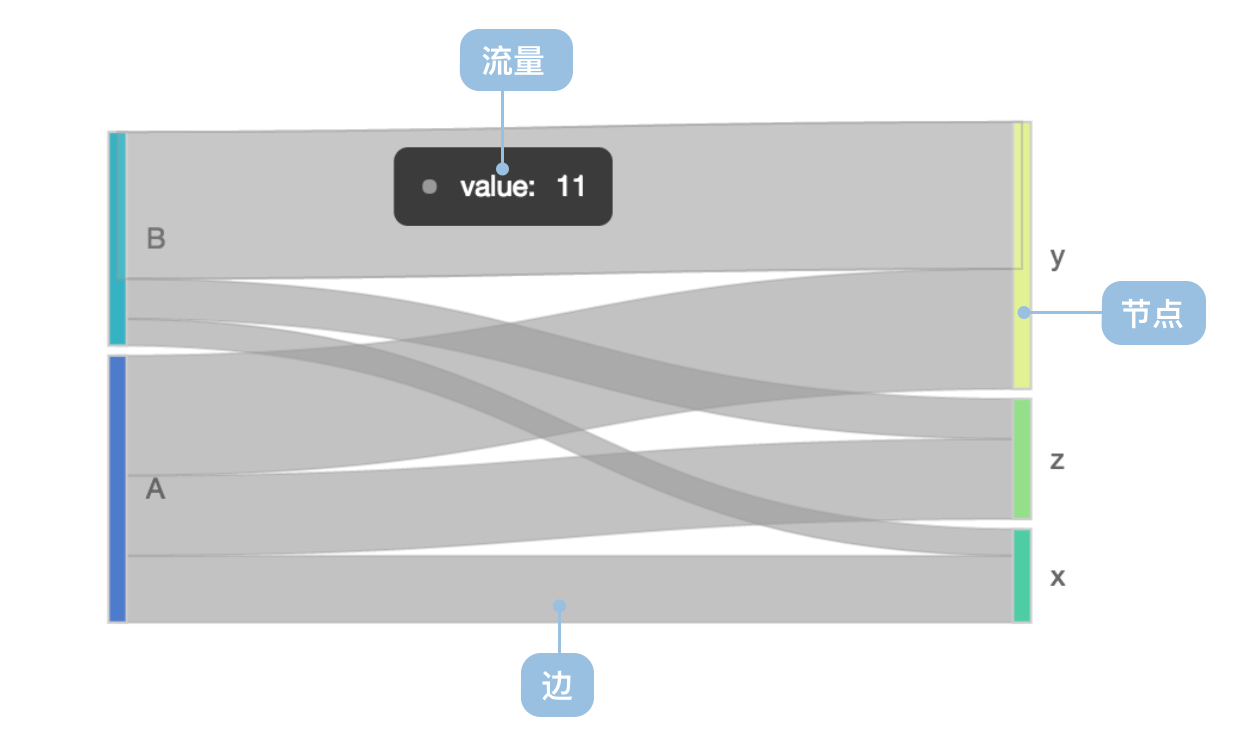 | 图表类型 | 基础桑基图 |
| ---------------- | -------------------------------------------------------------------------- |
| 适合的数据 | 流向数据:包含源节点(source)、目标节点(target)和流量值(value)的数据 |
| 功能 | 展示不同节点之间的流向关系和流量大小 |
| 数据与图形的映射 | 源节点映射到左侧位置
目标节点映射到右侧位置
流量值映射到连接线的宽度 |
| 适合的场景 | 展示能源流动、资金流向、用户路径等流程分析 |
## 桑基图的应用场景
### 适合的场景
例子 1: **适合展示能源流动分析**
下图是一个能源流动的桑基图,展示了从原始能源到最终消费的完整流程。
```ts
import { Chart } from '@antv/g2';
const chart = new Chart({
container: 'container',
theme: 'classic',
});
chart.options({
type: 'sankey',
autoFit: true,
data: {
type: 'fetch',
value: 'https://assets.antv.antgroup.com/g2/energy.json',
transform: [
{
type: 'custom',
callback: (data) => ({ links: data }),
},
],
},
layout: {
nodeAlign: 'center',
nodePadding: 0.03,
},
style: {
labelSpacing: 3,
labelFontWeight: 'bold',
nodeStrokeWidth: 1.2,
linkFillOpacity: 0.4,
},
});
chart.render();
```
**说明**:
- `source` 字段映射到起始节点,表示能源的来源
- `target` 字段映射到目标节点,表示能源的去向
- `value` 字段映射到连接线的宽度,表示流量的大小
- 通过颜色编码区分不同类型的能源流动
例子 2: **适合展示用户路径分析**
桑基图可以有效展示用户在网站或应用中的行为路径,帮助分析用户流失点和转化漏斗。
```ts
import { Chart } from '@antv/g2';
const data = {
links: [
{ source: '首页', target: '产品页', value: 1000 },
{ source: '首页', target: '关于我们', value: 300 },
{ source: '首页', target: '联系我们', value: 200 },
{ source: '产品页', target: '购物车', value: 600 },
{ source: '产品页', target: '产品详情', value: 400 },
{ source: '购物车', target: '结算页', value: 450 },
{ source: '购物车', target: '继续购物', value: 150 },
{ source: '结算页', target: '支付成功', value: 380 },
{ source: '结算页', target: '放弃支付', value: 70 },
{ source: '产品详情', target: '购物车', value: 200 },
{ source: '产品详情', target: '返回', value: 200 },
],
};
const chart = new Chart({
container: 'container',
theme: 'classic',
});
chart.options({
type: 'sankey',
autoFit: true,
data: { value: data },
layout: {
nodeAlign: 'justify',
nodePadding: 0.05,
},
style: {
labelSpacing: 5,
labelFontSize: 12,
nodeStrokeWidth: 2,
linkFillOpacity: 0.6,
},
scale: {
color: {
range: ['#1890ff', '#52c41a', '#faad14', '#f5222d', '#722ed1'],
},
},
});
chart.render();
```
**说明**:
- 展示了用户从首页到最终转化的完整路径
- 连接线的宽度表示用户流量的大小
- 可以清晰识别用户流失的关键节点
例子 3: **适合展示资金流向分析**
桑基图特别适合展示预算分配、成本分析等财务数据的流向关系。
```ts
import { Chart } from '@antv/g2';
const budgetData = {
links: [
{ source: '总预算', target: '研发部门', value: 5000000 },
{ source: '总预算', target: '市场部门', value: 3000000 },
{ source: '总预算', target: '运营部门', value: 2000000 },
{ source: '研发部门', target: '产品开发', value: 3000000 },
{ source: '研发部门', target: '技术研究', value: 2000000 },
{ source: '市场部门', target: '广告投放', value: 2000000 },
{ source: '市场部门', target: '品牌建设', value: 1000000 },
{ source: '运营部门', target: '人力成本', value: 1200000 },
{ source: '运营部门', target: '办公成本', value: 800000 },
{ source: '产品开发', target: '移动端', value: 1800000 },
{ source: '产品开发', target: '网页端', value: 1200000 },
{ source: '广告投放', target: '线上广告', value: 1500000 },
{ source: '广告投放', target: '线下推广', value: 500000 },
],
};
const chart = new Chart({
container: 'container',
theme: 'classic',
});
chart.options({
type: 'sankey',
autoFit: true,
data: { value: budgetData },
layout: {
nodeAlign: 'center',
nodePadding: 0.08,
},
style: {
labelSpacing: 8,
labelFontSize: 11,
nodeStrokeWidth: 1.5,
linkFillOpacity: 0.5,
},
scale: {
color: {
range: ['#096dd9', '#36cfc9', '#52c41a', '#faad14', '#ff7a45'],
},
},
});
chart.render();
```
**说明**:
- 清晰展示了预算从总体到具体项目的分配路径
- 通过流量宽度直观表示资金分配的比例
- 颜色编码帮助区分不同层级的预算项目
### 不适合的场景
例子 1: **不适合展示简单的分类对比**
当数据主要用于比较不同类别的数值大小,而非展示流向关系时,桑基图不是最佳选择。这种情况下,柱状图或饼图会更加直观。
```ts
import { Chart } from '@antv/g2';
// 示例:销售额对比数据(不适合用桑基图)
const salesData = [
{ category: '手机', value: 25000 },
{ category: '电脑', value: 18000 },
{ category: '平板', value: 12000 },
{ category: '耳机', value: 8000 },
{ category: '配件', value: 5000 },
];
const chart = new Chart({
container: 'container',
theme: 'classic',
});
chart.options({
type: 'interval',
autoFit: true,
data: { value: salesData },
encode: {
x: 'category',
y: 'value',
color: 'category',
},
axis: {
y: { title: '销售额(元)' },
x: { title: '产品类别' },
},
style: {
fill: '#1890ff',
},
});
chart.render();
```
**说明**:此类数据更适合使用柱状图展示,因为重点是比较各类别的数值大小,而非展示数据间的流向关系。桑基图在这种场景下会增加不必要的复杂性。
例子 2: **不适合展示过于复杂的网络关系**
当节点数量过多(超过 30 个)或流向关系过于复杂时,桑基图可能会变得难以阅读。这种情况下,可以考虑使用网络图或层次图。
```ts
import { Chart } from '@antv/g2';
// 示例:复杂的组织架构关系(不适合用桑基图)
const complexData = {
links: [
{ source: 'CEO', target: '研发VP', value: 1 },
{ source: 'CEO', target: '销售VP', value: 1 },
{ source: 'CEO', target: '市场VP', value: 1 },
{ source: 'CEO', target: '运营VP', value: 1 },
{ source: '研发VP', target: '前端团队', value: 1 },
{ source: '研发VP', target: '后端团队', value: 1 },
{ source: '研发VP', target: 'QA团队', value: 1 },
{ source: '研发VP', target: 'DevOps团队', value: 1 },
{ source: '销售VP', target: '直销团队', value: 1 },
{ source: '销售VP', target: '渠道团队', value: 1 },
{ source: '销售VP', target: '商务团队', value: 1 },
{ source: '销售VP', target: '客服团队', value: 1 },
{ source: '市场VP', target: '品牌团队', value: 1 },
{ source: '市场VP', target: '活动团队', value: 1 },
{ source: '市场VP', target: '内容团队', value: 1 },
{ source: '运营VP', target: '数据团队', value: 1 },
{ source: '运营VP', target: '产品团队', value: 1 },
{ source: '运营VP', target: '用户团队', value: 1 },
],
};
const chart = new Chart({
container: 'container',
theme: 'classic',
});
chart.options({
type: 'sankey',
autoFit: true,
data: { value: complexData },
layout: {
nodeAlign: 'justify',
nodePadding: 0.02,
},
style: {
labelSpacing: 2,
labelFontSize: 10,
nodeStrokeWidth: 1,
linkFillOpacity: 0.3,
},
});
chart.render();
```
**说明**:此类层次结构数据使用桑基图会显得过于拥挤且难以阅读。更适合使用组织架构图、树形图或网络图来展示这种层次关系。桑基图的优势在于展示有意义的"流量"关系,而非仅仅是组织结构。
## 桑基图的扩展
### 自定义节点对齐方式
可以通过不同的节点对齐方式来优化桑基图的布局效果。
```ts
import { Chart } from '@antv/g2';
const chart = new Chart({
container: 'container',
theme: 'classic',
});
chart.options({
type: 'sankey',
autoFit: true,
data: {
type: 'fetch',
value: 'https://assets.antv.antgroup.com/g2/energy.json',
transform: [
{
type: 'custom',
callback: (data) => ({ links: data.slice(0, 20) }), // 使用部分数据以便展示
},
],
},
layout: {
nodeAlign: 'left', // 可选值:'left', 'right', 'center', 'justify'
nodePadding: 0.05,
nodeWidth: 0.02,
},
style: {
labelSpacing: 5,
labelFontWeight: 'bold',
nodeStrokeWidth: 2,
linkFillOpacity: 0.3,
},
});
chart.render();
```
**说明**:
- `nodeAlign: 'left'` 将所有节点左对齐
- `nodePadding` 控制节点之间的间距
- `nodeWidth` 控制节点的宽度
### 自定义颜色映射
可以根据节点类型或流量方向自定义颜色映射。
```ts
import { Chart } from '@antv/g2';
const chart = new Chart({
container: 'container',
theme: 'classic',
});
chart.options({
type: 'sankey',
autoFit: true,
data: {
type: 'fetch',
value: 'https://assets.antv.antgroup.com/g2/energy.json',
transform: [
{
type: 'custom',
callback: (data) => ({ links: data }),
},
],
},
layout: {
nodeAlign: 'justify',
nodePadding: 0.03,
},
encode: {
color: (d, idx) => {
// 根据节点名称的首字母分配颜色
const firstChar = d.key?.charAt(0).toLowerCase() || '';
if (firstChar <= 'f') return '#1890ff';
if (firstChar <= 'n') return '#52c41a';
if (firstChar <= 's') return '#faad14';
return '#f5222d';
},
},
style: {
labelSpacing: 3,
labelFontWeight: 'bold',
nodeStrokeWidth: 1,
linkFillOpacity: 0.6,
},
});
chart.render();
```
**说明**:
- 通过 `encode.color` 自定义颜色映射函数
- 可以根据节点属性、流量大小等因素动态分配颜色
## 桑基图与其他图表的对比
### 桑基图和[漏斗图](/zh/charts/funnel/)
- 桑基图展示复杂的多对多流向关系,可以有多个源节点和目标节点
- 漏斗图主要展示单一路径的转化流程,通常用于分析业务转化率
- 桑基图的连接线宽度表示流量大小,漏斗图的层级宽度表示转化数量
- 桑基图适合复杂流程分析,漏斗图适合线性转化分析
### 桑基图和[和弦图](/zh/charts/chord/)
- 桑基图是有向的流动关系,强调流向性
- 和弦图主要展示无向的关联关系,强调相互关系的强度
- 桑基图适合流程分析,和弦图适合关系网络分析
## 相似图表
[Interactive content]()
## 分类
[Interactive content]()