---
title: "回归曲线图"
description: "用拟合曲线概括变量之间的关系和趋势,了解回归曲线图的分析用途及 G2 示例。"
language: "zh"
canonical: "https://g2.antv.antgroup.com/zh/charts/regressioncurve/"
version: "5.4.8"
---
[资料索引](/llms.txt)
 ## 回归曲线图的简介
回归曲线图是一种在散点图基础上添加回归曲线的统计图表,用于展示两个或多个变量之间的数学关系和预测趋势。回归曲线通过数学算法拟合数据点,找出变量间的最佳函数关系,帮助分析数据的内在规律和进行趋势预测。
回归曲线图结合了[散点图](/zh/charts/scatter-plot/)的数据分布展示能力和数学建模的预测功能,不仅能直观地显示数据点的分布,还能通过拟合曲线揭示变量间的潜在关系,是数据分析和科学研究中的重要工具。
常见的回归类型包括线性回归、多项式回归、指数回归、对数回归等,不同的回归方法适用于不同的数据模式和关系类型。
**英文名**:Regression Curve Chart
## 回归曲线图的构成
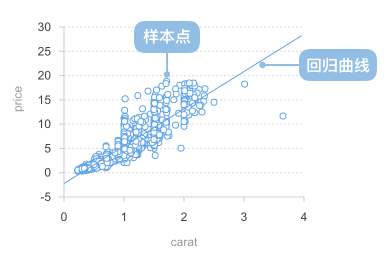 | 图表类型 | 回归曲线图 |
| ---------------- | ---------------------------------------------------------------------------------------------------------- |
| 适合的数据 | 两个连续数据字段:一个自变量字段、一个因变量字段 |
| 功能 | 展示变量间的数学关系,识别数据趋势,进行预测分析 |
| 数据与图形的映射 | 自变量字段映射到横轴位置
因变量字段映射到纵轴位置
数据点显示原始观测值
回归曲线显示拟合的数学关系 |
| 适合的数据条数 | 10-1000 条数据,数据点足够多才能有效进行回归分析 |
**组成元素:**
1. **散点(Scatter Points)**:表示原始数据观测值的点
2. **回归曲线(Regression Curve)**:通过数学算法拟合的趋势线
3. **X 轴(X-axis)**:水平坐标轴,通常表示自变量
4. **Y 轴(Y-axis)**:垂直坐标轴,通常表示因变量
5. **回归方程(Regression Equation)**:描述变量关系的数学公式
6. **决定系数(R²)**:衡量回归模型拟合优度的指标
## 回归曲线图的应用场景
### 适合的场景
例子 1: **线性关系数据分析**
线性回归适用于展示两个变量之间的线性关系,如身高与体重、温度与销量等。
```ts
import { Chart } from '@antv/g2';
import { regressionLinear } from 'd3-regression';
const chart = new Chart({
container: 'container',
theme: 'classic',
});
chart.options({
type: 'view',
autoFit: true,
data: {
type: 'fetch',
value: 'https://assets.antv.antgroup.com/g2/linear-regression.json',
},
children: [
{
type: 'point',
encode: { x: (d) => d[0], y: (d) => d[1] },
scale: { x: { domain: [0, 1] }, y: { domain: [0, 5] } },
style: { fillOpacity: 0.75, fill: '#1890ff' },
},
{
type: 'line',
data: {
transform: [
{
type: 'custom',
callback: regressionLinear(),
},
],
},
encode: { x: (d) => d[0], y: (d) => d[1] },
style: { stroke: '#30BF78', lineWidth: 2 },
labels: [
{
text: 'y = 1.7x + 3.01',
selector: 'last',
position: 'right',
textAlign: 'end',
dy: -8,
},
],
tooltip: false,
},
],
axis: {
x: { title: '自变量 X' },
y: { title: '因变量 Y' },
},
});
chart.render();
```
**说明**:
- 散点显示原始数据分布
- 线性回归线揭示两变量间的线性关系
- 回归方程提供了精确的数学描述
- 适用于预测和趋势分析
例子 2: **非线性关系 - 二次回归**
当数据呈现弯曲趋势时,可以使用二次回归(抛物线)来拟合数据。
```ts
import { Chart } from '@antv/g2';
import { regressionQuad } from 'd3-regression';
const chart = new Chart({
container: 'container',
theme: 'classic',
});
const data = [
{ x: -4, y: 5.2 },
{ x: -3, y: 2.8 },
{ x: -2, y: 1.5 },
{ x: -1, y: 0.8 },
{ x: 0, y: 0.5 },
{ x: 1, y: 0.8 },
{ x: 2, y: 1.5 },
{ x: 3, y: 2.8 },
{ x: 4, y: 5.2 },
];
chart.options({
type: 'view',
autoFit: true,
data,
children: [
{
type: 'point',
encode: { x: 'x', y: 'y' },
style: { fillOpacity: 0.75, fill: '#1890ff' },
},
{
type: 'line',
data: {
transform: [
{
type: 'custom',
callback: regressionQuad()
.x((d) => d.x)
.y((d) => d.y)
.domain([-4, 4]),
},
],
},
encode: { x: (d) => d[0], y: (d) => d[1] },
style: { stroke: '#30BF78', lineWidth: 2 },
labels: [
{
text: 'y = 0.3x² + 0.5',
selector: 'last',
textAlign: 'end',
dy: -8,
},
],
tooltip: false,
},
],
axis: {
x: { title: '自变量 X' },
y: { title: '因变量 Y' },
},
});
chart.render();
```
**说明**:
- 二次回归适合展示具有抛物线特征的数据关系
- 能够捕获数据的弯曲趋势和极值点
- 常用于物理学、经济学中的非线性关系分析
例子 3: **指数增长趋势分析**
指数回归适用于展示指数增长或衰减的数据模式,如人口增长、细菌繁殖等。
```ts
import { Chart } from '@antv/g2';
import { regressionExp } from 'd3-regression';
const chart = new Chart({
container: 'container',
theme: 'classic',
});
chart.options({
type: 'view',
autoFit: true,
data: {
type: 'fetch',
value: 'https://assets.antv.antgroup.com/g2/exponential-regression.json',
},
children: [
{
type: 'point',
encode: { x: (d) => d[0], y: (d) => d[1] },
scale: {
x: { domain: [0, 18] },
y: { domain: [0, 100000] },
},
style: { fillOpacity: 0.75, fill: '#1890ff' },
},
{
type: 'line',
data: {
transform: [
{
type: 'custom',
callback: regressionExp(),
},
],
},
encode: {
x: (d) => d[0],
y: (d) => d[1],
shape: 'smooth',
},
style: { stroke: '#30BF78', lineWidth: 2 },
labels: [
{
text: 'y = 3477.32e^(0.18x)\nR² = 0.998',
selector: 'last',
textAlign: 'end',
dy: -20,
},
],
tooltip: false,
},
],
axis: {
x: { title: '时间' },
y: {
title: '数值',
labelFormatter: '~s',
},
},
});
chart.render();
```
**说明**:
- 指数回归适合分析快速增长或衰减的趋势
- R² 值接近 1 表示拟合效果很好
- 常用于预测具有指数特征的未来趋势
### 不适合的场景
例子 1: **数据点过少的情况**
当数据点太少时,回归分析可能不够可靠,容易产生误导性的结论。
```ts
import { Chart } from '@antv/g2';
import { regressionLinear } from 'd3-regression';
const chart = new Chart({
container: 'container',
theme: 'classic',
});
const insufficientData = [
{ x: 1, y: 2 },
{ x: 3, y: 4 },
{ x: 5, y: 3 },
];
chart.options({
type: 'view',
autoFit: true,
data: insufficientData,
children: [
{
type: 'point',
encode: { x: 'x', y: 'y' },
style: {
fillOpacity: 0.8,
fill: '#ff4d4f',
r: 8,
},
},
{
type: 'line',
data: {
transform: [
{
type: 'custom',
callback: regressionLinear()
.x((d) => d.x)
.y((d) => d.y),
},
],
},
encode: { x: (d) => d[0], y: (d) => d[1] },
style: {
stroke: '#ff4d4f',
lineWidth: 2,
strokeDasharray: [4, 4],
},
tooltip: false,
},
],
axis: {
x: { title: '变量 X' },
y: { title: '变量 Y' },
},
title: '不适合:数据点过少的回归分析',
});
chart.render();
```
**问题说明**:
- 仅有 3 个数据点,样本量不足
- 回归线的可靠性和预测能力有限
- 容易受到异常值的影响
- 建议至少需要 10 个以上的数据点进行回归分析
例子 2: **无明显相关关系的数据**
当两个变量之间没有明显的相关关系时,强行添加回归线可能会误导分析。
```ts
import { Chart } from '@antv/g2';
import { regressionLinear } from 'd3-regression';
const chart = new Chart({
container: 'container',
theme: 'classic',
});
// 生成随机分布的数据(无相关关系)
const randomData = Array.from({ length: 30 }, (_, i) => ({
x: Math.random() * 10,
y: Math.random() * 10,
}));
chart.options({
type: 'view',
autoFit: true,
data: randomData,
children: [
{
type: 'point',
encode: { x: 'x', y: 'y' },
style: {
fillOpacity: 0.8,
fill: '#ff4d4f',
r: 6,
},
},
{
type: 'line',
data: {
transform: [
{
type: 'custom',
callback: regressionLinear()
.x((d) => d.x)
.y((d) => d.y),
},
],
},
encode: { x: (d) => d[0], y: (d) => d[1] },
style: {
stroke: '#ff4d4f',
lineWidth: 2,
strokeDasharray: [4, 4],
},
labels: [
{
text: 'R² ≈ 0.02 (极低)',
selector: 'last',
textAlign: 'end',
dy: -8,
},
],
tooltip: false,
},
],
axis: {
x: { title: '变量 X' },
y: { title: '变量 Y' },
},
title: '不适合:无相关关系的数据',
});
chart.render();
```
**问题说明**:
- 数据点呈现随机分布,无明显的趋势模式
- R² 值极低,说明回归模型几乎无法解释变量关系
- 回归线没有实际意义,可能误导决策
- 应该先进行相关性分析,确认变量间存在关系后再进行回归
## 回归曲线图的扩展
### 多项式回归
当数据呈现复杂的弯曲趋势时,可以使用多项式回归来拟合更复杂的曲线。
```ts
import { Chart } from '@antv/g2';
import { regressionPoly } from 'd3-regression';
const chart = new Chart({
container: 'container',
theme: 'classic',
});
const polynomialData = [
{ x: 0, y: 140 },
{ x: 1, y: 149 },
{ x: 2, y: 159.6 },
{ x: 3, y: 159 },
{ x: 4, y: 155.9 },
{ x: 5, y: 169 },
{ x: 6, y: 162.9 },
{ x: 7, y: 169 },
{ x: 8, y: 180 },
];
chart.options({
type: 'view',
autoFit: true,
data: polynomialData,
children: [
{
type: 'point',
encode: { x: 'x', y: 'y' },
style: { fillOpacity: 0.75, fill: '#1890ff' },
},
{
type: 'line',
data: {
transform: [
{
type: 'custom',
callback: regressionPoly()
.x((d) => d.x)
.y((d) => d.y),
},
],
},
encode: {
x: (d) => d[0],
y: (d) => d[1],
shape: 'smooth',
},
style: { stroke: '#30BF78', lineWidth: 2 },
labels: [
{
text: 'y = 0.24x³ - 3.00x² + 13.45x + 139.77\nR² = 0.92',
selector: 'last',
textAlign: 'end',
dx: -8,
dy: -20,
},
],
tooltip: false,
},
],
axis: {
x: { title: '时间' },
y: { title: '数值' },
},
});
chart.render();
```
**说明**:
- 多项式回归能够拟合复杂的弯曲关系
- 适合处理具有多个波峰波谷的数据
- 需要注意避免过拟合问题
### 对数回归
对数回归适用于增长率逐渐减缓的数据模式。
```ts
import { Chart } from '@antv/g2';
import { regressionLog } from 'd3-regression';
const chart = new Chart({
container: 'container',
theme: 'classic',
});
chart.options({
type: 'view',
autoFit: true,
data: {
type: 'fetch',
value: 'https://assets.antv.antgroup.com/g2/logarithmic-regression.json',
},
children: [
{
type: 'point',
encode: { x: 'x', y: 'y' },
scale: { x: { domain: [0, 35] } },
style: { fillOpacity: 0.75, fill: '#1890ff' },
},
{
type: 'line',
data: {
transform: [
{
type: 'custom',
callback: regressionLog()
.x((d) => d.x)
.y((d) => d.y)
.domain([0.81, 35]),
},
],
},
encode: {
x: (d) => d[0],
y: (d) => d[1],
shape: 'smooth',
},
style: { stroke: '#30BF78', lineWidth: 2 },
labels: [
{
text: 'y = 0.881·ln(x) + 4.173\nR² = 0.958',
selector: 'last',
textAlign: 'end',
dy: -20,
},
],
tooltip: false,
},
],
axis: {
x: { title: '变量 X' },
y: { title: '变量 Y' },
},
});
chart.render();
```
**说明**:
- 对数回归适合展示边际递减效应
- 常用于分析学习曲线、收益递减等场景
- 能够处理增长率逐渐下降的数据模式
### 多变量回归对比
可以在同一图表中展示多种回归方法的对比效果。
```ts
import { Chart } from '@antv/g2';
import { regressionLinear, regressionQuad } from 'd3-regression';
const chart = new Chart({
container: 'container',
theme: 'classic',
});
const comparisonData = [
{ x: 1, y: 2.1 },
{ x: 2, y: 3.9 },
{ x: 3, y: 6.8 },
{ x: 4, y: 10.2 },
{ x: 5, y: 15.1 },
{ x: 6, y: 21.5 },
{ x: 7, y: 29.8 },
{ x: 8, y: 40.2 },
];
chart.options({
type: 'view',
autoFit: true,
data: comparisonData,
children: [
{
type: 'point',
encode: { x: 'x', y: 'y' },
style: {
fillOpacity: 0.8,
fill: '#1890ff',
r: 6,
},
},
// 线性回归
{
type: 'line',
data: {
transform: [
{
type: 'custom',
callback: regressionLinear()
.x((d) => d.x)
.y((d) => d.y),
},
],
},
encode: { x: (d) => d[0], y: (d) => d[1] },
style: {
stroke: '#ff4d4f',
lineWidth: 2,
strokeDasharray: [4, 4],
},
tooltip: false,
},
// 二次回归
{
type: 'line',
data: {
transform: [
{
type: 'custom',
callback: regressionQuad()
.x((d) => d.x)
.y((d) => d.y),
},
],
},
encode: { x: (d) => d[0], y: (d) => d[1] },
style: {
stroke: '#30BF78',
lineWidth: 2,
},
tooltip: false,
},
],
axis: {
x: { title: '变量 X' },
y: { title: '变量 Y' },
},
legends: [
{
color: {
position: 'top',
itemMarker: (color, index) => {
if (index === 0)
return {
symbol: 'line',
style: { stroke: '#ff4d4f', strokeDasharray: [4, 4] },
};
if (index === 1)
return { symbol: 'line', style: { stroke: '#30BF78' } };
},
data: [
{ color: '#ff4d4f', value: '线性回归' },
{ color: '#30BF78', value: '二次回归' },
],
},
},
],
});
chart.render();
```
**说明**:
- 可以同时展示多种回归方法的拟合效果
- 有助于选择最适合数据特征的回归模型
- 通过对比分析找到最佳的拟合方法
## 回归曲线图与其他图表的对比
### 回归曲线图和[散点图](/zh/charts/scatter-plot/)
- 回归曲线图在散点图基础上增加了数学建模和预测功能
- 散点图专注于展示数据分布和相关性,回归曲线图更注重趋势分析和预测
- 当需要进行趋势预测时选择回归曲线图,当仅需观察数据分布时选择散点图
### 回归曲线图和[折线图](/zh/charts/line/)
- 回归曲线图基于数学模型拟合,折线图直接连接数据点
- 回归曲线图能够平滑噪声并进行预测,折线图准确反映每个数据点
- 当需要分析趋势规律时选择回归曲线图,当需要展示精确变化时选择折线图
## 相似图表
[Interactive content]()
## 分类
[Interactive content]()