---
title: "玉珏图"
description: "用不同半径上的弧长表达类别数值,了解玉珏图的环形布局、比较方式及 G2 示例。"
language: "zh"
canonical: "https://g2.antv.antgroup.com/zh/charts/radial-bar/"
version: "5.4.8"
---
[资料索引](/llms.txt)
 ## 玉珏图的简介
玉珏图(又名环形柱状图),是柱状图关于笛卡尔坐标系转换到极坐标系的仿射变换。其意义和用法与[柱状图](/zh/charts/bar/)类似。
玉珏图有**半径反馈效应**。由于玉珏图中是用**角度**表示每个珏环数值的大小,角度是决定性因素。所以,哪怕外侧(半径大的)珏环的数值小于内侧(半径小的)珏环,外侧的每个珏环会相对的比里面的珏环更长。这会造成视觉上的误解。
而且因为我们的视觉系统更善于比较直线,所以笛卡尔坐标系更适合于比较各个分类的数值比较。所以玉珏图从**实用**的角度去看,其更多的是一种**审美**上的需求。
**英文名**:Radial Bar Chart
## 玉珏图的构成
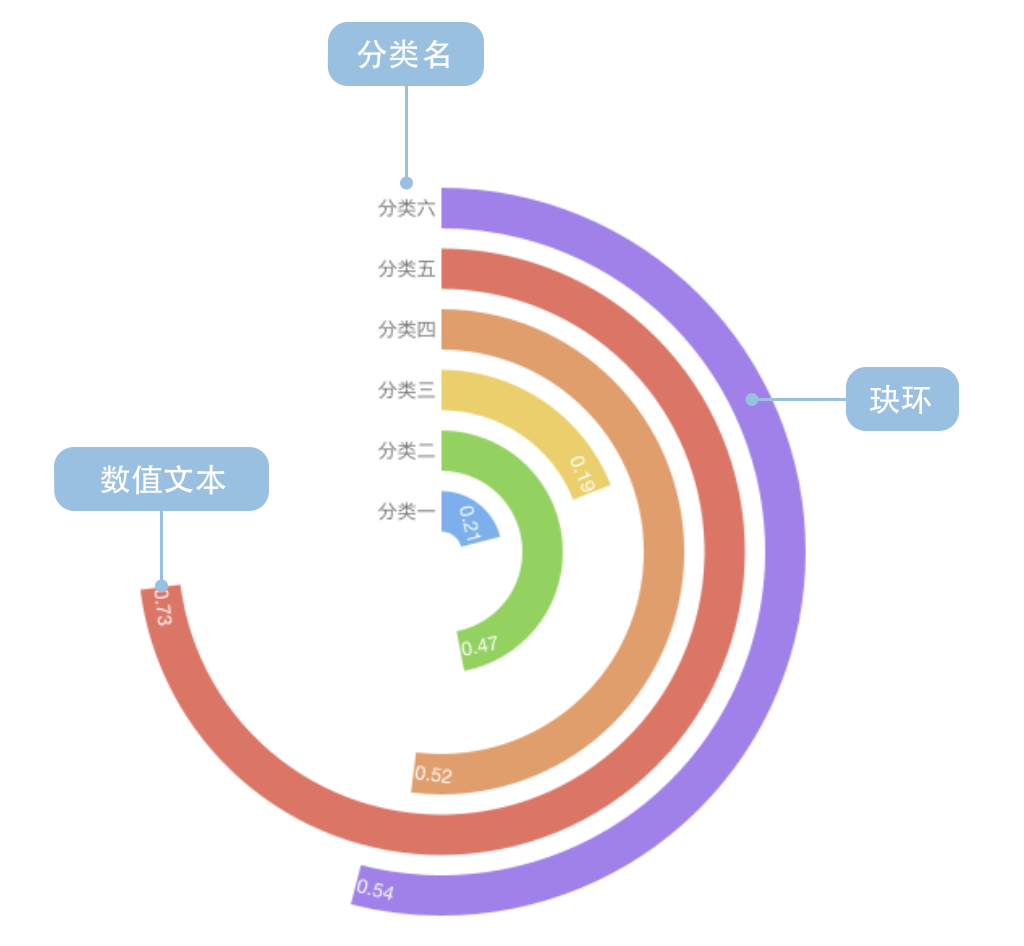 | 图表类型 | 玉珏图 |
| ---------------- | -------------------------------------------------------------------------------------- |
| 适合的数据 | 列表:一个分类数据字段、一个连续数据字段 |
| 功能 | 以审美的方式展示分类数据的数值大小对比 |
| 数据与图形的映射 | 分类数据字段映射到环形位置
连续数据字段映射到弧长(角度)
可以用颜色区分不同分类 |
| 适合的数据条数 | 不超过 15 条数据 |
一个完整的玉珏图包含以下构成元素:
- **珏环**:角度表示数值
- **文本**:数值、分类名
## 玉珏图的应用场景
### 适合的场景
例子 1: **展示分类数据的对比(需要排序)**
下图反映了美国民众对不同领域中的中美问题关注程度。
| 问题 | 关注人数比例 |
| ------------------------ | ------------ |
| 台海关系 | 0.21 |
| 中国持续增长的军事力量 | 0.47 |
| 中国对全球环境的影响 | 0.49 |
| 美国对中国的贸易逆差 | 0.52 |
| 中国的人权政策 | 0.53 |
| 来自中国的网络攻击 | 0.54 |
| 中国带走了美国的就业岗位 | 0.60 |
| 中国持有美国巨额国债 | 0.67 |
```ts
import { Chart } from '@antv/g2';
const chart = new Chart({
container: 'container',
theme: 'classic',
width: 1000,
height: 700,
});
chart.options({
type: 'interval',
data: [
{ question: '台海关系', percent: 0.21, odd: 0 },
{ question: '中国持续增长的军事力量', percent: 0.47, odd: 1 },
{ question: '中国对全球环境的影响', percent: 0.49, odd: 0 },
{ question: '美国对中国的贸易逆差', percent: 0.52, odd: 1 },
{ question: '中国的人权政策', percent: 0.53, odd: 0 },
{ question: '来自中国的网络攻击', percent: 0.54, odd: 1 },
{ question: '中国带走了美国的就业岗位', percent: 0.6, odd: 0 },
{ question: '中国持有美国巨额国债', percent: 0.67, odd: 1 },
],
coordinate: { type: 'radial', innerRadius: 0.2 },
encode: {
x: 'question',
y: 'percent',
color: 'odd',
},
scale: {
color: {
range: ['rgb(211,0,57)', 'rgb(224,74,116)'],
},
y: { domain: [0, 1] },
},
style: {
radiusTopLeft: 4,
radiusTopRight: 4,
},
label: {
text: 'percent',
position: 'inside',
style: {
fontWeight: 'bold',
fill: 'white',
},
},
axis: {
x: {
label: {
autoRotate: true,
autoEllipsis: true,
style: {
fontSize: 10,
},
},
},
y: {
label: false,
grid: false,
},
},
interaction: [
{
type: 'elementHighlight',
background: true,
},
],
});
chart.render();
```
例子 2: **展示各国数据对比**
下图反映了各国人民认为气候变化是严重问题的比例。
```ts
import { Chart } from '@antv/g2';
const chart = new Chart({
container: 'container',
theme: 'classic',
width: 1200,
height: 800,
});
chart.options({
type: 'interval',
data: [
{ country: '中国', percent: 0.18, condition: '特殊' },
{ country: '俄罗斯', percent: 0.33, condition: '一般' },
{ country: '英国', percent: 0.41, condition: '一般' },
{ country: '美国', percent: 0.45, condition: '一般' },
{ country: '韩国', percent: 0.48, condition: '一般' },
{ country: '加拿大', percent: 0.51, condition: '一般' },
{ country: '德国', percent: 0.55, condition: '一般' },
{ country: '越南', percent: 0.69, condition: '一般' },
{ country: '巴西', percent: 0.86, condition: '一般' },
],
coordinate: {
type: 'radial',
innerRadius: 0.3,
startAngle: -Math.PI,
endAngle: -0.25 * Math.PI,
},
encode: {
x: 'country',
y: 'percent',
color: 'condition',
},
scale: {
color: {
range: ['#2370AE', '#A34265', '#505051'],
},
},
style: {
radiusTopLeft: 2,
radiusTopRight: 2,
},
label: {
text: 'percent',
position: 'inside',
style: {
fontWeight: 'bold',
fill: 'white',
fontSize: 10,
},
},
axis: {
x: {
label: {
autoRotate: true,
autoEllipsis: true,
style: {
fontSize: 12,
},
},
},
y: {
label: false,
grid: false,
},
},
interaction: [
{
type: 'elementHighlight',
background: true,
},
],
});
chart.render();
```
### 不适合的场景
例子 1: **未排序的数据会产生误导**
简介中提到玉珏图具有半径反馈效应。视觉上半径越大的珏环会看起来更大,半径小的则小。造成玉珏图的误用。所以,我们认为玉珏图使用时必须进行**排序**。
下面展示错误和正确的对比:
**错误示例(未排序):**
```ts
import { Chart } from '@antv/g2';
const chart = new Chart({
container: 'container',
theme: 'classic',
width: 1000,
height: 700,
});
chart.options({
type: 'interval',
data: [
{ country: '巴西', percent: 0.86, condition: '一般' },
{ country: '越南', percent: 0.69, condition: '一般' },
{ country: '德国', percent: 0.55, condition: '一般' },
{ country: '加拿大', percent: 0.51, condition: '一般' },
{ country: '韩国', percent: 0.48, condition: '一般' },
{ country: '美国', percent: 0.45, condition: '一般' },
{ country: '英国', percent: 0.41, condition: '一般' },
{ country: '俄罗斯', percent: 0.33, condition: '一般' },
{ country: '中国', percent: 0.18, condition: '特殊' },
],
coordinate: {
type: 'radial',
innerRadius: 0.2,
startAngle: -Math.PI,
endAngle: -0.25 * Math.PI,
},
encode: {
x: 'country',
y: 'percent',
color: 'condition',
},
scale: {
color: {
range: ['#2370AE', '#A34265', '#505051'],
},
},
style: {
radiusTopLeft: 2,
radiusTopRight: 2,
},
axis: {
x: {
label: {
autoRotate: true,
autoEllipsis: true,
style: {
fontSize: 10,
},
},
},
y: {
label: false,
grid: false,
},
},
interaction: [
{
type: 'elementHighlight',
background: true,
},
],
});
chart.render();
```
在上面的错误示例中,由于数据未排序,外圈的巴西(0.86)会在视觉上显得比内圈的中国(0.18)大很多,但这种视觉差异会被半径效应进一步放大,造成误导。
## 玉珏图的扩展
### 分组玉珏图
可以通过颜色或分组来展示多维度的数据对比:
```ts
import { Chart } from '@antv/g2';
const chart = new Chart({
container: 'container',
theme: 'classic',
width: 1000,
height: 700,
});
chart.options({
type: 'interval',
data: [
{ category: 'A类产品', value: 85, quarter: 'Q1' },
{ category: 'B类产品', value: 75, quarter: 'Q1' },
{ category: 'C类产品', value: 65, quarter: 'Q1' },
{ category: 'D类产品', value: 55, quarter: 'Q1' },
{ category: 'E类产品', value: 45, quarter: 'Q1' },
],
coordinate: { type: 'radial', innerRadius: 0.2 },
encode: {
x: 'category',
y: 'value',
color: 'category',
},
scale: {
y: { domain: [0, 100] },
},
style: {
radiusTopLeft: 8,
radiusTopRight: 8,
},
label: {
text: 'value',
position: 'inside',
style: {
fontWeight: 'bold',
fill: 'white',
},
},
axis: {
x: {
label: {
autoRotate: true,
autoEllipsis: true,
style: {
fontSize: 10,
},
},
},
y: {
label: false,
grid: false,
},
},
interaction: [
{
type: 'elementHighlight',
background: true,
},
],
});
chart.render();
```
## 玉珏图与其他图表的对比
### 玉珏图和[柱状图](/zh/charts/bar/)
- **玉珏图**:使用极坐标系,通过弧长表示数值,更具视觉美感,但存在半径反馈效应,数据对比准确性较低
- **柱状图**:使用直角坐标系,通过矩形长度表示数值,数据对比更准确直观
### 玉珏图和饼图
- **玉珏图**:展示各分类的绝对数值大小
- **饼图**:展示各分类在总体中的占比关系
### 玉珏图和雷达图
- **玉珏图**:专注于单一维度数值的分类对比
- **雷达图**:展示多维度指标的综合表现
## 相似图表
[Interactive content]()
## 分类
[Interactive content]()