---
title: "柱状图"
description: "用柱子的高度或长度比较不同类别的数值,了解柱状图的数据要求、适用场景及 G2 绘制示例。"
language: "zh"
canonical: "https://g2.antv.antgroup.com/zh/charts/bar/"
version: "5.4.8"
---
[资料索引](/llms.txt)
 ## 柱状图的简介
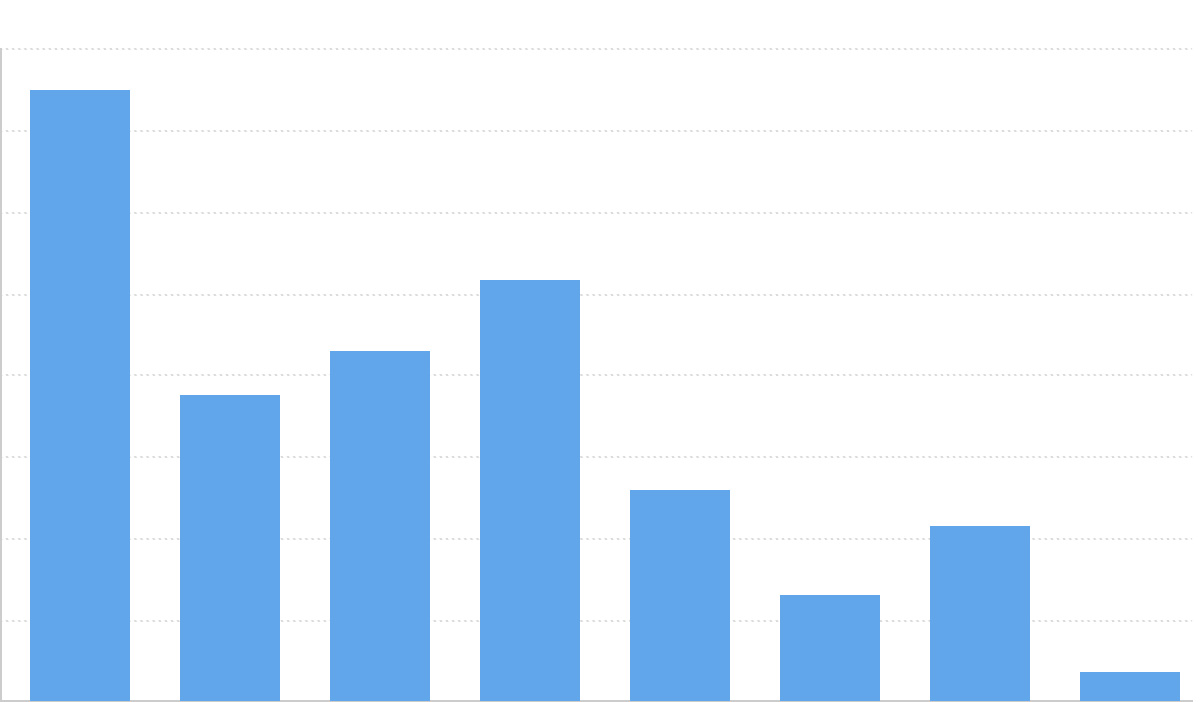
典型的柱状图(又名条形图),使用垂直或水平的柱子显示类别之间的数值比较。其中一个轴表示需要对比的分类维度,另一个轴代表相应的数值。
柱状图有别于[直方图](/zh/charts/histogram/),柱状图无法显示数据在一个区间内的连续变化趋势。柱状图描述的是分类数据,回答的是每一个分类中“有多少?”这个问题。
需要注意的是,当柱状图显示的分类很多时会导致分类名层叠等显示问题,下面我们会举例说明。
**英文名**:Column chart, Bar chart
## 柱状图的构成
### 纵向柱状图
 | 图表类型 | 纵向柱状图 |
| ---------------- | ------------------------------------------------------------------------------------------------------- |
| 适合的数据 | 列表:一个分类数据字段、一个连续数据字段 |
| 功能 | 对比分类数据的数值大小 |
| 数据与图形的映射 | 分类数据字段映射到横轴的位置
连续数据字段映射到矩形的高度
分类数据也可以设置颜色增强分类的区分度 |
| 适合的数据条数 | 不超过 12 条数据 |
---
### 横向柱状图 (条形图)
 | 图表类型 | 横向柱状图 |
| ---------------- | ------------------------------------------------------------ |
| 适合的数据 | 列表:一个分类数据字段、一个连续数据字段 |
| 功能 | 对比分类数据的数值大小 |
| 数据与图形的映射 | 分类数据字段映射到纵轴的位置
连续数据字段映射到矩形的宽度 |
| 适合的数据条数 | 不超过 30 条数据 |
## 柱状图的应用场景
### 适合的场景
例子 1: **适合应用到分类数据对比**
下图是一个游戏销量的图表,展示不同游戏类型的销量对比。
| genre(游戏类型) | sold(销售量) |
| ----------------- | -------------- |
| Sports | 27,500 |
| Strategy | 11,500 |
| Action | 6,000 |
| Shooter | 3,500 |
| Other | 1,500 |
```ts
import { Chart } from '@antv/g2';
const chart = new Chart({
container: 'container',
theme: 'classic',
});
chart.options({
type: 'interval',
autoFit: true,
data: [
{ genre: 'Sports', sold: 275 },
{ genre: 'Strategy', sold: 115 },
{ genre: 'Action', sold: 120 },
{ genre: 'Shooter', sold: 350 },
{ genre: 'Other', sold: 150 },
],
encode: { x: 'genre', y: 'sold', color: 'genre' },
interaction: [
{
type: 'elementHighlight',
background: true,
region: true,
},
],
});
chart.render();
```
**说明** :
- `genre` 字段,同时使用了`位置`和`颜色`用于区分不同的游戏类型
- `sold` 字段,使用矩形的`长度`,表示销售量的大小
### 不适合的场景
例子 1: **分类太多不适合使用纵向柱状图**
如对比不同省份的人口数量。分类情况过多时,柱状图的文本为了排布合理,需要进行旋转,不利于阅读,相比于纵向柱状图,横向柱状图更适用于此类分类较多的场景。
| province(省份) | population(人口数量) |
| ---------------- | ---------------------- |
| 北京市 | 19,612,368 |
| 天津市 | 12,938,693 |
| 河北省 | 71,854,210 |
| ... | ... |
```ts
import { Chart } from '@antv/g2';
const chart = new Chart({
container: 'container',
theme: 'classic',
});
chart.options({
type: 'interval',
autoFit: true,
data: [
{ province: '北京市', population: 19612368 },
{ province: '天津市', population: 12938693 },
{ province: '河北省', population: 71854210 },
{ province: '山西省', population: 27500000 },
{ province: '内蒙古自治区', population: 24706291 },
{ province: '辽宁省', population: 43746323 },
{ province: '吉林省', population: 27452815 },
{ province: '黑龙江省', population: 38313991 },
{ province: '上海市', population: 23019196 },
{ province: '江苏省', population: 78660941 },
{ province: '浙江省', population: 54426891 },
{ province: '安徽省', population: 59500468 },
{ province: '福建省', population: 36894217 },
{ province: '江西省', population: 44567797 },
{ province: '山东省', population: 95792719 },
{ province: '河南省', population: 94029939 },
{ province: '湖北省', population: 57237727 },
{ province: '湖南省', population: 65700762 },
{ province: '广东省', population: 104320459 },
{ province: '广西壮族自治区', population: 46023761 },
{ province: '海南省', population: 8671485 },
{ province: '重庆市', population: 28846170 },
{ province: '四川省', population: 80417528 },
{ province: '贵州省', population: 34748556 },
{ province: '云南省', population: 45966766 },
{ province: '西藏自治区', population: 3002165 },
{ province: '陕西省', population: 37327379 },
{ province: '甘肃省', population: 25575263 },
{ province: '青海省', population: 5626723 },
],
encode: { x: 'province', y: 'population' },
axis: {
y: {
title: null,
},
x: {
title: null,
labelFontSize: 12,
size: 100, // 必须设置 size
labelAutoEllipsis: {
suffix: '..',
minLength: 8,
maxLength: 12,
},
labelAutoWrap: {
wordWrapWidth: 80,
maxLines: 2,
recoverWhenFailed: true,
},
labelAutoRotate: {
optionalAngles: [0, 45, 90], // 尝试旋转 0 度、45 度、90 度
recoverWhenFailed: true, // 如果旋转后无法解决问题,恢复到默认角度
},
labelAutoHide: {
keepHeader: true, // 保留第一个刻度值
keepTail: true, // 保留最后一个刻度值
},
},
},
interaction: [
{
type: 'elementHighlight',
background: true,
region: true,
},
],
});
chart.render();
```
使用横向柱状图,文本可以横向排布,便于用户的阅读,效果如下:
```ts
import { Chart } from '@antv/g2';
const chart = new Chart({
container: 'container',
theme: 'classic',
});
chart.options({
type: 'interval',
autoFit: true,
data: [
{ province: '北京市', population: 19612368 },
{ province: '天津市', population: 12938693 },
{ province: '河北省', population: 71854210 },
{ province: '山西省', population: 27500000 },
{ province: '内蒙古自治区', population: 24706291 },
{ province: '辽宁省', population: 43746323 },
{ province: '吉林省', population: 27452815 },
{ province: '黑龙江省', population: 38313991 },
{ province: '上海市', population: 23019196 },
{ province: '江苏省', population: 78660941 },
{ province: '浙江省', population: 54426891 },
{ province: '安徽省', population: 59500468 },
{ province: '福建省', population: 36894217 },
{ province: '江西省', population: 44567797 },
{ province: '山东省', population: 95792719 },
{ province: '河南省', population: 94029939 },
{ province: '湖北省', population: 57237727 },
{ province: '湖南省', population: 65700762 },
{ province: '广东省', population: 104320459 },
{ province: '广西壮族自治区', population: 46023761 },
{ province: '海南省', population: 8671485 },
{ province: '重庆市', population: 28846170 },
{ province: '四川省', population: 80417528 },
{ province: '贵州省', population: 34748556 },
{ province: '云南省', population: 45966766 },
{ province: '西藏自治区', population: 3002165 },
{ province: '陕西省', population: 37327379 },
{ province: '甘肃省', population: 25575263 },
{ province: '青海省', population: 5626723 },
],
encode: { x: 'province', y: 'population' },
coordinate: { transform: [{ type: 'transpose' }] },
axis: {
y: {
title: null,
},
x: {
title: null,
},
},
interaction: [
{
type: 'elementHighlight',
background: true,
region: true,
},
],
});
chart.render();
```
例子 2: **不适合表示趋势**
柱状图使用矩形的长度(宽度)来对比分类数据的大小,非常方便临近的数据进行大小的对比,不适合展示连续数据的趋势。下图本想展示 ACME 这只股票在 2015 年 9 月份整个月的每日的价格走势,但是效果不尽人意。
```ts
import { Chart } from '@antv/g2';
const chart = new Chart({
container: 'container',
theme: 'classic',
});
chart.options({
type: 'interval',
autoFit: true,
data: [
{ day: '2015/9/1', share: 10 },
{ day: '2015/9/2', share: 12 },
{ day: '2015/9/3', share: 11 },
{ day: '2015/9/4', share: 15 },
{ day: '2015/9/5', share: 20 },
{ day: '2015/9/6', share: 22 },
{ day: '2015/9/7', share: 21 },
{ day: '2015/9/8', share: 25 },
{ day: '2015/9/9', share: 31 },
{ day: '2015/9/10', share: 32 },
{ day: '2015/9/11', share: 28 },
{ day: '2015/9/12', share: 29 },
{ day: '2015/9/13', share: 40 },
{ day: '2015/9/14', share: 41 },
{ day: '2015/9/15', share: 45 },
{ day: '2015/9/16', share: 50 },
{ day: '2015/9/17', share: 65 },
{ day: '2015/9/18', share: 45 },
{ day: '2015/9/19', share: 50 },
{ day: '2015/9/20', share: 51 },
{ day: '2015/9/21', share: 65 },
{ day: '2015/9/22', share: 60 },
{ day: '2015/9/23', share: 62 },
{ day: '2015/9/24', share: 65 },
{ day: '2015/9/25', share: 45 },
{ day: '2015/9/26', share: 55 },
{ day: '2015/9/27', share: 59 },
{ day: '2015/9/28', share: 52 },
{ day: '2015/9/29', share: 53 },
{ day: '2015/9/30', share: 40 },
],
encode: { x: 'day', y: 'share' },
axis: {
y: {
title: null,
},
x: {
title: null,
},
},
interaction: [
{
type: 'elementHighlight',
background: true,
region: true,
},
],
});
chart.render();
```
随着有序的时间变化的数值趋势,更适合使用[折线图](/zh/charts/line/)或者[面积图](/zh/charts/area/)。
```ts
import { Chart } from '@antv/g2';
const chart = new Chart({
container: 'container',
theme: 'classic',
});
chart.options({
type: 'view',
autoFit: true,
data: [
{ day: '2015/9/1', share: 10 },
{ day: '2015/9/2', share: 12 },
{ day: '2015/9/3', share: 11 },
{ day: '2015/9/4', share: 15 },
{ day: '2015/9/5', share: 20 },
{ day: '2015/9/6', share: 22 },
{ day: '2015/9/7', share: 21 },
{ day: '2015/9/8', share: 25 },
{ day: '2015/9/9', share: 31 },
{ day: '2015/9/10', share: 32 },
{ day: '2015/9/11', share: 28 },
{ day: '2015/9/12', share: 29 },
{ day: '2015/9/13', share: 40 },
{ day: '2015/9/14', share: 41 },
{ day: '2015/9/15', share: 45 },
{ day: '2015/9/16', share: 50 },
{ day: '2015/9/17', share: 65 },
{ day: '2015/9/18', share: 45 },
{ day: '2015/9/19', share: 50 },
{ day: '2015/9/20', share: 51 },
{ day: '2015/9/21', share: 65 },
{ day: '2015/9/22', share: 60 },
{ day: '2015/9/23', share: 62 },
{ day: '2015/9/24', share: 65 },
{ day: '2015/9/25', share: 45 },
{ day: '2015/9/26', share: 55 },
{ day: '2015/9/27', share: 59 },
{ day: '2015/9/28', share: 52 },
{ day: '2015/9/29', share: 53 },
{ day: '2015/9/30', share: 40 },
],
encode: { x: 'day', y: 'share' },
axis: {
y: {
title: null,
},
x: {
title: null,
tickFilter: (_, i) => i % 2 !== 0, // 过滤 x 轴刻度线,只显示每隔 1 个刻度线
},
},
children: [
{
type: 'area',
style: {
opacity: 0.6,
},
},
{
type: 'line',
style: {
lineWidth: 3,
},
},
],
});
chart.render();
```
## 柱状图与其他图表的对比
### 柱状图和[折线图](/zh/charts/line/)、[饼图](/zh/charts/pie/)
- 柱状图主要用于多个分类间的数据(大小、数值)的对比
- 折线图主要用于展示连续数值(例如时间)或者有序分类的变化趋势
- 饼图主要是展示分类之间的占比情况
### 柱状图和南丁格尔图(玫瑰图)
- 南丁格尔图(玫瑰图)通过半径的大小来对比数据
- 柱状图根据矩形的长度来对比数据
## 相似图表
[Interactive content]()
## 分类
[Interactive content]()