---
title: "K-Chart"
description: "Describe price movements with open, close, high, and low values. Learn candlestick chart structure and financial analysis use cases with G2 examples."
language: "en"
canonical: "https://g2.antv.antgroup.com/en/charts/k-chart/"
version: "5.4.8"
---
[Resource index](/llms.txt)
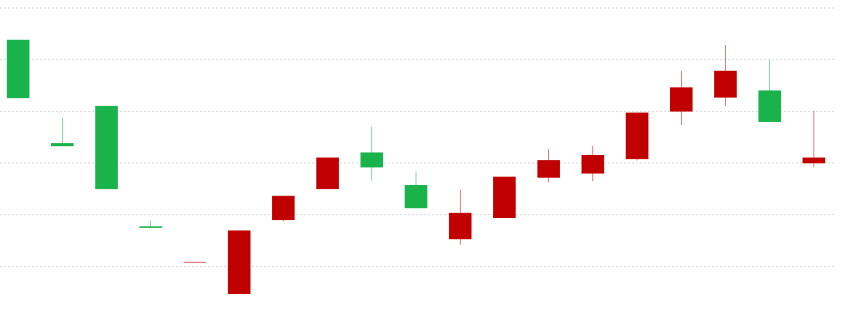 ## Introduction to K-Charts
K-Charts, originally known as Candlestick Charts, are commonly used to display stock trading data. A K-line graphically represents the daily, weekly, or monthly changes in a stock's opening price, closing price, highest price, and lowest price.
Through its intuitive visual representation, K-Charts can quickly reflect price trends over a certain period, helping analysts and investors judge market trends. Each K-line contains four key pieces of price information: opening price, closing price, highest price, and lowest price. These four prices constitute complete trading information.
The design concept of K-Charts originated in Japan, initially used for rice futures trading, and later widely adopted in technical analysis across various financial markets.
**Other Names**: Candlestick Chart (also known as Yin-Yang lines, bar lines, red-black lines, or candle lines).
## Components of a K-Chart
### Structure of a Single K-Line
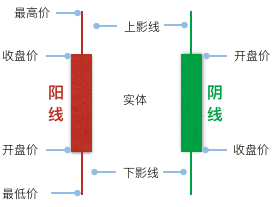 A K-line is structured as follows:
1. **Upper Shadow**: The thin line at the top, representing the price difference between the highest price and the closing price (or opening price).
2. **Real Body**: The thick line in the middle, representing the price difference between the opening price and the closing price.
3. **Lower Shadow**: The thin line at the bottom, representing the price difference between the opening price (or closing price) and the lowest price.
When the closing price is higher than the opening price, meaning the stock price is trending upwards, the K-line is called a Yang line (bullish candle). Its real body is usually represented in red or hollow. Conversely, it's called a Yin line (bearish candle), represented by a green or black real body.
| Chart Type | K-Chart |
| -------------------- | ------------------------------------------------------------------------------------------------------------------------------------------------------------------ |
| Suitable Data | Time series: One time field, four numerical fields (open, close, high, low prices) |
| Function | Observe data **trends**
**Compare** price ranges across different periods |
| Data-Graphic Mapping | Time field mapped to the horizontal axis
Four price fields mapped to the vertical axis, forming the K-line's body and shadows
Up/down status mapped to color |
| Suitable Data Count | Suitable for medium to long-term data, typically tens to hundreds of trading periods |
## Use Cases of K-Charts
### Suitable Use Cases
**Scenario 1: Stock Price Analysis**
The most classic application of K-Charts is in stock market analysis. By observing the patterns of K-lines, one can judge the balance of power between bulls and bears in the market.
```ts
import { Chart } from '@antv/g2';
const chart = new Chart({
container: 'container',
autoFit: true,
});
const data = [
{ time: '2015-11-19', start: 8.18, max: 8.33, min: 7.98, end: 8.32 },
{ time: '2015-11-18', start: 8.37, max: 8.6, min: 8.03, end: 8.09 },
{ time: '2015-11-17', start: 8.7, max: 8.78, min: 8.32, end: 8.37 },
{ time: '2015-11-16', start: 8.48, max: 8.85, min: 8.43, end: 8.7 },
{ time: '2015-11-13', start: 8.01, max: 8.75, min: 7.97, end: 8.41 },
{ time: '2015-11-12', start: 7.76, max: 8.18, min: 7.61, end: 8.15 },
{ time: '2015-11-11', start: 7.55, max: 7.81, min: 7.49, end: 7.8 },
{ time: '2015-11-10', start: 7.5, max: 7.68, min: 7.44, end: 7.57 },
];
const tooltip = {
title: 'time',
items: [
{ field: 'start', name: 'Open' },
{ field: 'end', name: 'Close' },
{ field: 'min', name: 'Low' },
{ field: 'max', name: 'High' },
],
};
chart.options({
type: 'view',
data,
encode: {
x: 'time',
color: (d) => {
const trend = Math.sign(d.start - d.end);
// Note: In many Western contexts, red is down and green is up.
// This example uses red for up ('上涨') and green for down ('下跌').
// Translated labels: 'Down', 'Unchanged', 'Up'
// Original colors: Down '#4daf4a' (green), Up '#e41a1c' (red)
return trend > 0 ? 'Down' : trend === 0 ? 'Unchanged' : 'Up';
},
},
scale: {
x: {
compare: (a, b) => new Date(a).getTime() - new Date(b).getTime(),
},
color: {
domain: ['Down', 'Unchanged', 'Up'],
range: ['#4daf4a', '#999999', '#e41a1c'], // Green for Down, Gray for Unchanged, Red for Up
},
},
children: [
{
type: 'link',
encode: { y: ['min', 'max'] },
tooltip,
},
{
type: 'interval',
encode: { y: ['start', 'end'] },
style: {
fillOpacity: 1,
stroke: (d) => {
if (d.start === d.end) return '#999999';
},
},
axis: {
y: {
title: 'Price',
},
},
tooltip,
},
],
});
chart.render();
```
**Scenario 2: Commodity Futures Analysis**
K-Charts are also applicable to the price analysis of commodity futures, foreign exchange, and other financial derivatives, helping traders identify price patterns and trends.
**Scenario 3: Cryptocurrency Analysis**
In cryptocurrency trading, K-Charts are the most commonly used technical analysis tool, clearly displaying price fluctuations.
**Scenario 4: Comprehensive Market Analysis with Volume Data**
Combining K-Charts with volume indicators provides a more holistic view of market dynamics.
- **K-Charts with Volume Charts**
Pairing K-Charts with volume bar charts allows for a more comprehensive analysis of market behavior.
```ts
import { Chart } from '@antv/g2';
// Create containers for K-Chart and Volume Chart
document.getElementById('container').innerHTML = `
`;
const data = [
{
time: '2015-11-19',
start: 8.18,
max: 8.33,
min: 7.98,
end: 8.32,
volumn: 1810,
},
{
time: '2015-11-18',
start: 8.37,
max: 8.6,
min: 8.03,
end: 8.09,
volumn: 2790,
},
{
time: '2015-11-17',
start: 8.7,
max: 8.78,
min: 8.32,
end: 8.37,
volumn: 3729,
},
{
time: '2015-11-16',
start: 8.48,
max: 8.85,
min: 8.43,
end: 8.7,
volumn: 2890,
},
];
const KChart = new Chart({
container: 'kChart',
autoFit: true,
});
KChart.options({
type: 'view',
data,
encode: {
x: 'time',
color: (d) => {
const trend = Math.sign(d.start - d.end);
return trend > 0 ? 'Down' : trend === 0 ? 'Unchanged' : 'Up';
},
},
scale: {
color: {
domain: ['Down', 'Unchanged', 'Up'],
range: ['#4daf4a', '#999999', '#e41a1c'],
},
},
children: [
{
type: 'link',
encode: { y: ['min', 'max'] },
},
{
type: 'interval',
encode: { y: ['start', 'end'] },
style: { fillOpacity: 1 },
},
],
axis: {
y: { title: 'Price' },
},
});
// Volume Chart
const VolumeChart = new Chart({
container: 'volumeChart',
autoFit: true,
});
VolumeChart.options({
type: 'interval',
data,
encode: {
x: 'time',
y: 'volumn',
color: (d) => {
const trend = Math.sign(d.start - d.end);
return trend > 0 ? 'Down' : trend === 0 ? 'Unchanged' : 'Up';
},
},
scale: {
color: {
domain: ['Down', 'Unchanged', 'Up'],
range: ['#4daf4a', '#999999', '#e41a1c'],
},
},
axis: {
y: { title: 'Volume' },
},
});
KChart.render();
VolumeChart.render();
```
**Notes**:
- The K-Chart section displays the four key price points (open, close, high, low).
- The Volume Chart section uses the same color encoding to display trading volume.
- Both charts are aligned by the same time axis for easy correlation analysis.
- **K-Charts with Bar Charts for Volume (Full Data Source)**
Using a more complete data source, combine K-Charts and bar charts to show the relationship between stock prices and trading volume, with support for legend interaction.
```ts
import { Chart } from '@antv/g2';
// Create containers for K-Chart and Column Chart
document.getElementById('container').innerHTML = `
`;
const KChart = new Chart({
container: 'kChart',
autoFit: true,
height: 360,
paddingLeft: 60,
});
KChart.options({
type: 'view',
data: {
type: 'fetch',
value:
'https://gw.alipayobjects.com/os/antvdemo/assets/data/candle-sticks.json',
},
encode: {
x: 'time',
color: (d) => {
const trend = Math.sign(d.start - d.end);
return trend > 0 ? 'Down' : trend === 0 ? 'Unchanged' : 'Up';
},
},
scale: {
x: {
compare: (a, b) => new Date(a).getTime() - new Date(b).getTime(),
},
color: {
domain: ['Down', 'Unchanged', 'Up'],
range: ['#4daf4a', '#999999', '#e41a1c'],
},
},
children: [
{
type: 'link',
encode: { y: ['min', 'max'] },
tooltip: {
title: 'time',
items: [
{ field: 'start', name: 'Open' },
{ field: 'end', name: 'Close' },
{ field: 'min', name: 'Low' },
{ field: 'max', name: 'High' },
],
},
},
{
type: 'interval',
encode: { y: ['start', 'end'] },
style: {
fillOpacity: 1,
stroke: (d) => (d.start === d.end ? '#999999' : undefined),
},
axis: {
x: { title: false },
y: { title: false },
},
tooltip: {
title: 'time',
items: [
{ field: 'start', name: 'Open' },
{ field: 'end', name: 'Close' },
{ field: 'min', name: 'Low' },
{ field: 'max', name: 'High' },
],
},
},
],
});
const ColumnChart = new Chart({
container: 'columnChart',
autoFit: true,
paddingTop: 0,
paddingBottom: 0,
height: 180,
paddingLeft: 60,
});
ColumnChart.options({
type: 'interval',
data: {
type: 'fetch',
value:
'https://gw.alipayobjects.com/os/antvdemo/assets/data/candle-sticks.json',
},
encode: {
x: 'time',
y: 'volumn',
color: (d) => {
const trend = Math.sign(d.start - d.end);
return trend > 0 ? 'Down' : trend === 0 ? 'Unchanged' : 'Up';
},
},
scale: {
x: {
compare: (a, b) => new Date(a).getTime() - new Date(b).getTime(),
},
color: {
domain: ['Down', 'Unchanged', 'Up'],
range: ['#4daf4a', '#999999', '#e41a1c'],
},
},
axis: {
x: false,
y: { title: false },
},
});
// Legend interaction linkage
KChart.on('legend:filter', (e) => {
const { nativeEvent, data } = e;
if (!nativeEvent) return;
ColumnChart.emit('legend:filter', { data });
});
KChart.on('legend:reset', (e) => {
const { nativeEvent, data } = e;
if (!nativeEvent) return;
ColumnChart.emit('legend:reset', { data });
});
KChart.render();
ColumnChart.render();
```
**Notes**:
- The upper K-Chart displays price trends, while the lower bar chart shows trading volume.
- Both charts use the same color encoding and are aligned by the time axis.
- Supports legend interaction: clicking the legend filters data in both charts simultaneously.
- Uses real stock data source to display more complete market information.
### Unsuitable Use Cases
**Scenario 1: Non-Time Series Data**
K-Charts are specifically designed for time series data. For comparing categorical data that does not involve a time dimension, [Bar Charts](/en/charts/bar/) or [Column Charts](/en/charts/bar/) should be used.
**Scenario 2: Displaying Single Numerical Trends**
If you only need to show simple numerical trends, [Line Charts](/en/charts/line/) or [Area Charts](/en/charts/area/) would be more concise and clear.
## Comparing K-Charts to Other Charts
### K-Charts vs. [Line Charts](/en/charts/line/), [Bar Charts](/en/charts/bar/), and [Box Plots](/en/charts/boxplot/)
**K-Charts and [Line Charts](/en/charts/line/):**
- K-Charts display complete price information (open, close, high, low), suitable for detailed technical analysis.
- Line Charts only show a single price line (usually the closing price), suitable for displaying the overall direction of price trends.
**K-Charts and [Bar Charts](/en/charts/bar/):**
- K-Charts are specifically used for analyzing price data in time series, emphasizing price changes over time.
- Bar Charts are mainly used for comparing numerical values between different categories and do not involve time series.
**K-Charts and [Box Plots](/en/charts/boxplot/):**
- K-Charts show the price range at specific time points, focusing on price trend analysis.
- Box Plots display the statistical distribution characteristics of data, focusing on the statistical analysis of data distribution.
## Similar Charts
[Interactive content]()
## Categories
[Interactive content]()